OpenCensus for IoT

Table of contents
Background
Our application is a prototype which demonstrates how we can utilize OpenCensus for the observability in the IoT industry. With the service of metric collection and monitoring provided by OpenCensus, we’ll gain the insights into hardware and software performance across distributed IoT devices.
Requirements
- Raspberry Pi 2B+ with Go 1.8 or greater installed
- PC under Mac OS or UNIX
- Raspberry Pi and PC are under the same LAN
- Arduino UNO with Arduino IDE 1.8.5 or greater
- Sensors including DHT11, HTU21D and SparkFun sound detector
- A Google Cloud project with Stackdriver Monitoring enabled. You could also use other backend servers such as Prometheus.
Installation
go get -u github.com/census-ecosystem/opencensus-experimentsPackages to import
To run the system, we’ll import the following packages.
| Package Name | Package link |
|---|---|
| The OpenCensus Go package | go.opencensus.io/ |
| The StackDriver exporter package | contrib.go.opencensus.io/exporter/stackdriver |
| The Gobot Go package | gobot.io |
Gobot is a framework for robots, drones, and the Internet of Things (IoT), written in the Go programming language.
For more information you can read about it here and get started Gobot Docs
Since we implement automation of system deployment, details about package installation could be found in the shell scripts referenced in the end of article.
Technical detour
The application consists of two individual systems. Both systems are built on Raspberry Pi 2B+.
System I
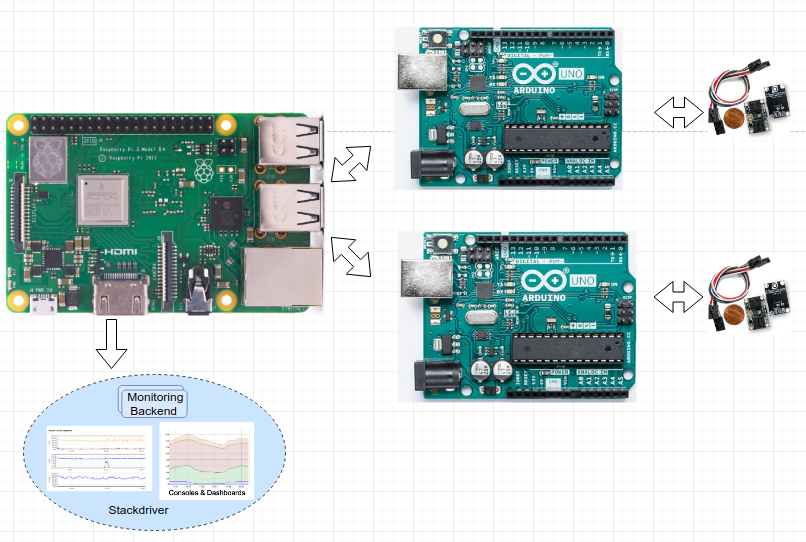
Architecture
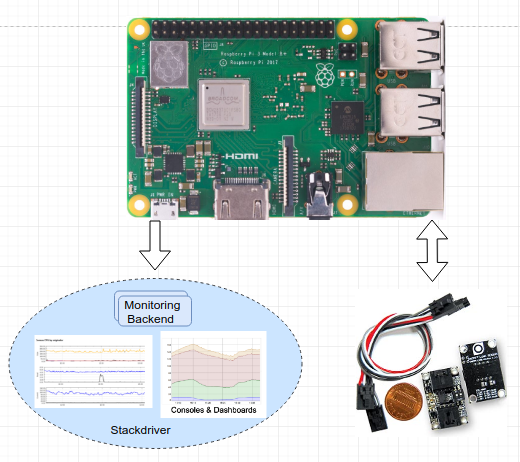
In the first system, Raspberry Pi collects data from multiple sensors and then calls the API provided by the OpenCensus framework to record the sensor data. The recorded raw data would firstly be aggregated in a user-defined way and then periodically be exported to the backend server such as Stackdriver. Afterwards, they would be persisted and visualized so that we could verify and analyze them.
System Configuration
Step 1:
cd $(go env GOPATH)/src/github.com/census-ecosystem/oepncensus-experiments/go/iot/sensor
./configure.sh raspberry-id raspberry-ip-address rasberry-ssh-password
During this step, you would install the required dependencies and configure the Google Cloud environment. After the configuration, the google cloud default confidentials would be installed in the Pi end.
Step 2:
./run.sh raspberry-id raspberry-ip-address raspberry-ssh-passwordWhen running the above command, the executable binary file would be transmitted to the Raspberry Pi end.
Note: The system requires that the environment variable PROJECTID is set. Otherwise it would throw out an error.
System Demo
In the first system, we collect metrics including temperature and light strength inside Google Building MP1 for around ten days. The sensor data is persisted and visualized in the Stackdriver backend.
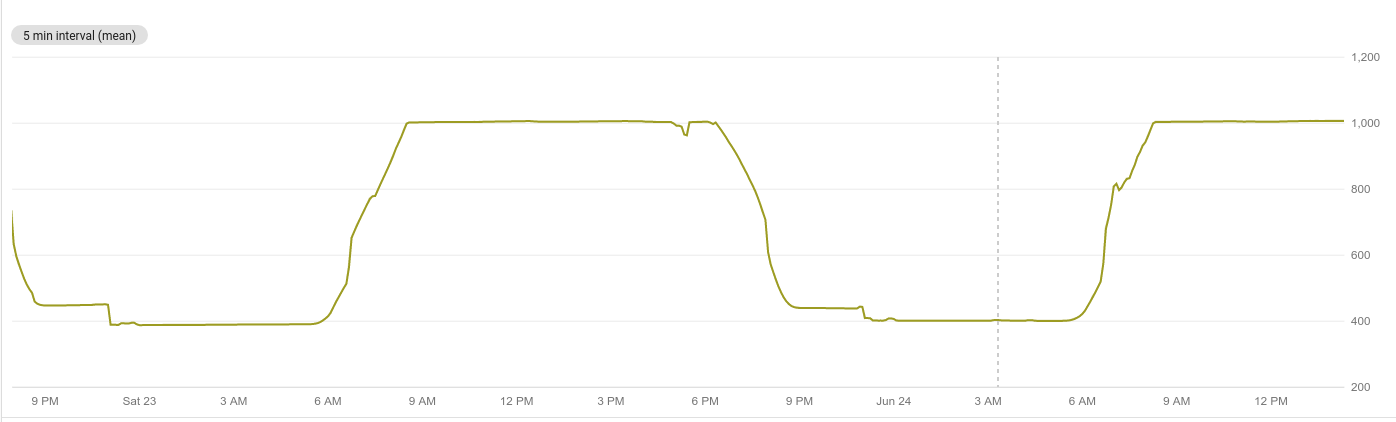
The temperature data in around ten days is shown as below.
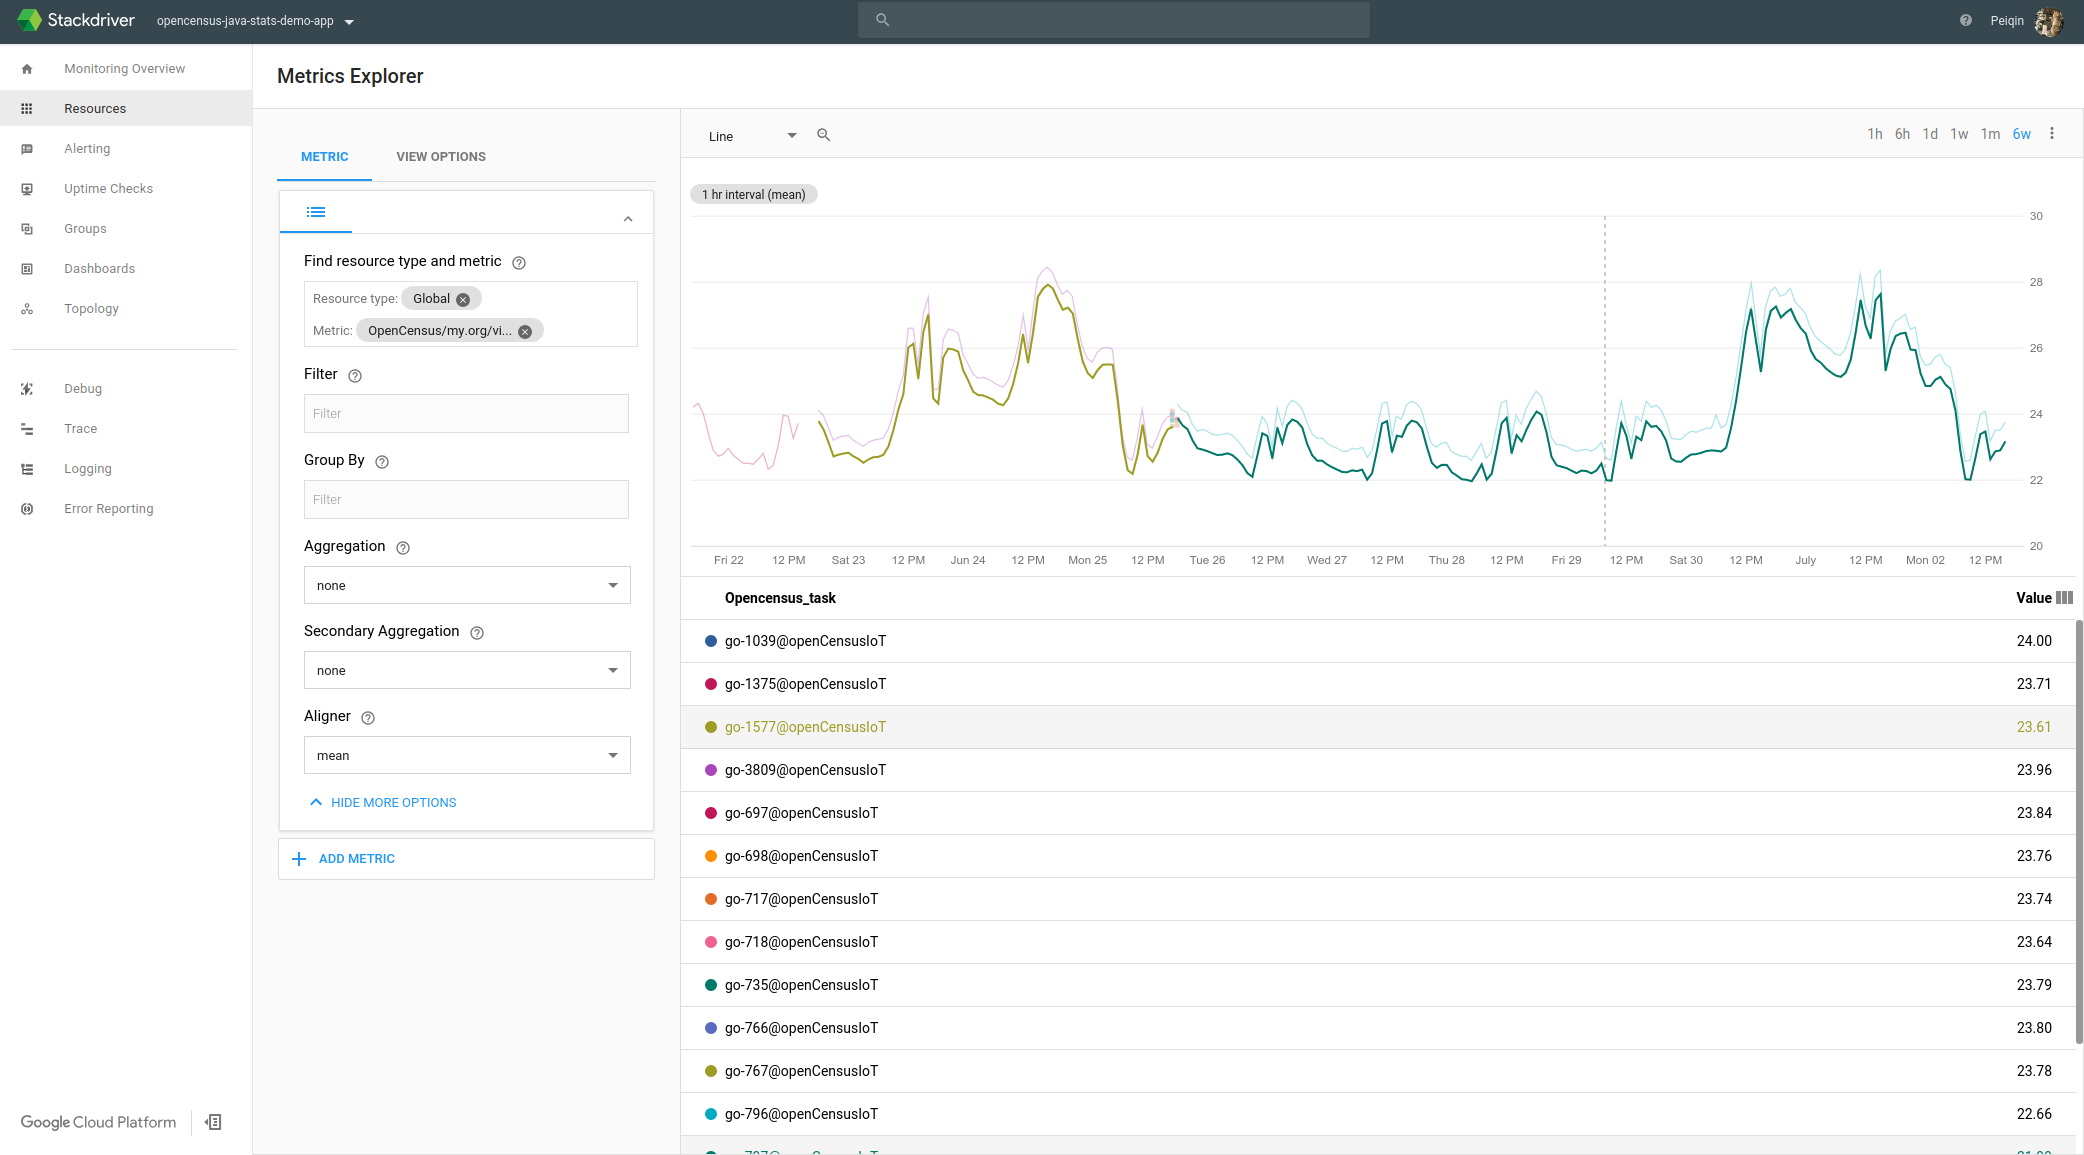
You could see that temperature in the weekends fluctuates much more than that in the weekdays. Moreover, the temperature almost remains constantly around 23 degrees in the weekdays. The reason for it is that the automated air conditioner only works from 7 AM to 7 PM during weekdays.
The temperature data in a day is shown as below.
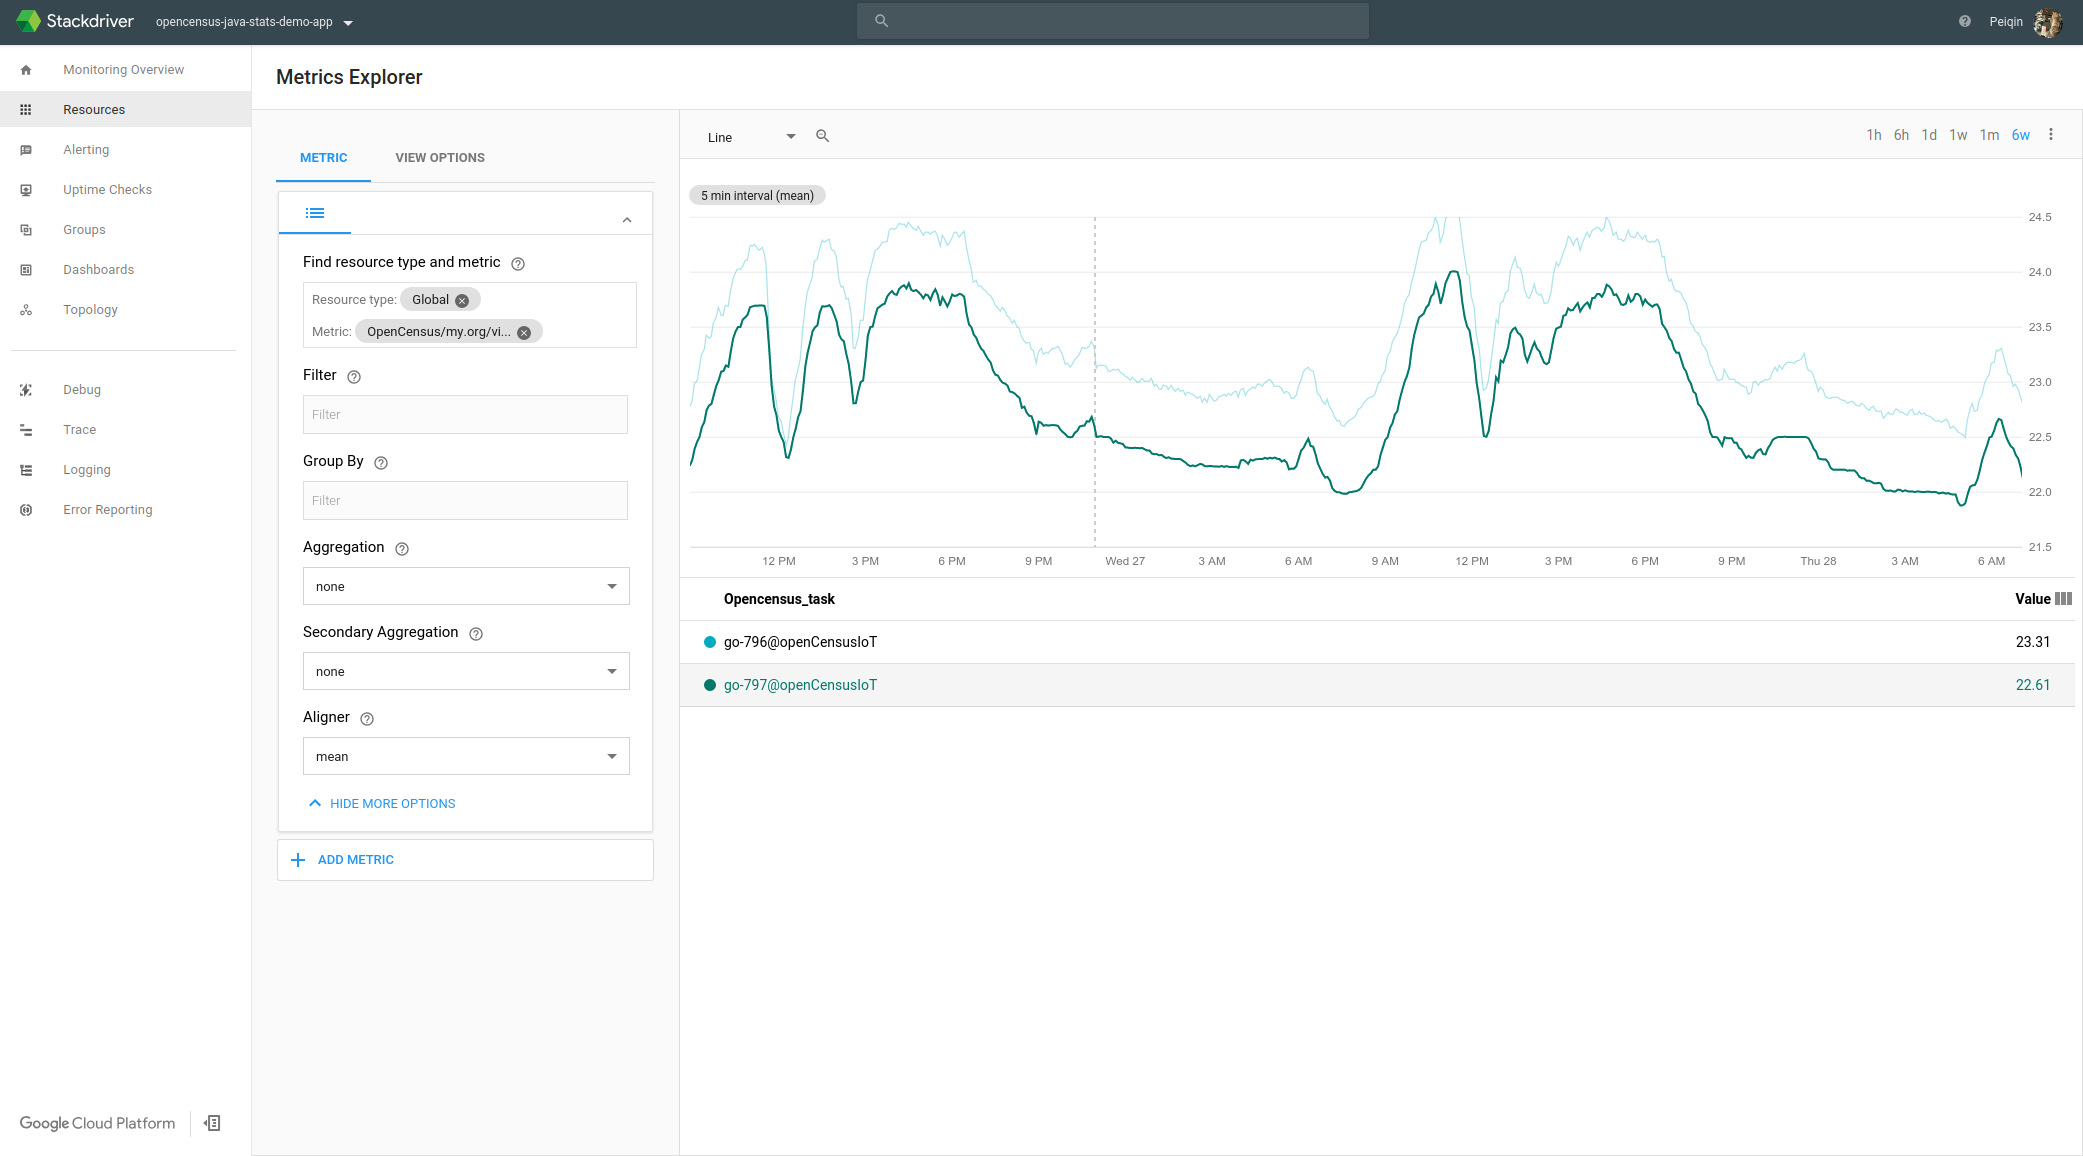
From the graph, we could notice the trend that temperature increases more sharply in the morning than that in the afternoon, which proves the high efficiency of air conditioner system inside Google.
It is also worth mentioning that there are actually two plots in the graph, one is highlighted while the other is not. The data sources for these two plots are two individual sensors with the same model. The difference of the plots shows that the precision and sensitivity of two sensors are quite different.
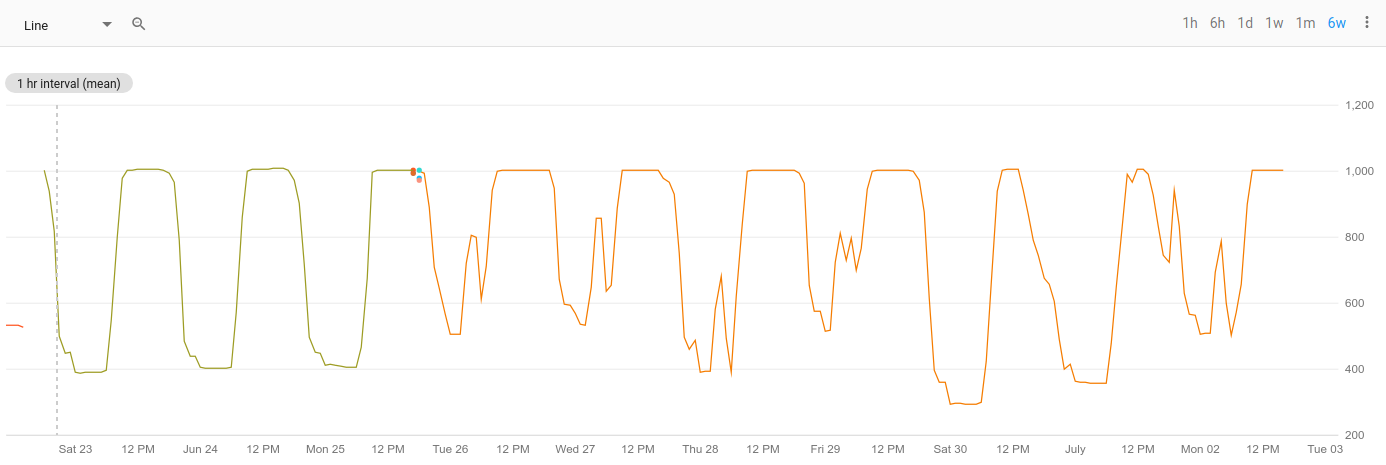
The light strength data in a week is shown as below.
The light strength data in a day is shown as below.
On the whole, the light strength shows a very similar trend as the temperature: The light strength would increase to a high level at 6 AM and decrease to a low level at 7 PM every day. Different from temperature, the light strength would keep this trend in the weekend.
One interesting phenomenon is that there are sometimes sudden peaks during the night in the graph. The reason is that Google staffs would come to the building for cleaning in the late evening. Even after they finish their work and leave, there would be a delay for the human detectors inside the building.
System II
Architecture
In the second system, we redesign the architecture of the above system: Data export is implemented on Raspberry Pi (leader) while data collection is implemented on Arduino (follower). In this way, the system could be more cohesive and low-cost because one expensive Pi could receive data from more cheap sensors.
Protocol
To decouple the leader and follower nodes in the System II, we design a robust and low-overhead protocol to support efficient coordination between any IoT device and the leader node under OpenCensus. Data collection could be implemented on any cheap embedded platform if it follows the protocol.
The protocol defines the basic format of messages exchanged between the leader and follower nodes. One example is as below:
{
	"Name": "my.org/measure/Temperature",
	"Value": "23.57",
	"Tags": {
	    "DeviceId": "Arduino-1",
	    "SampleDate": "2018-08-08"
	}
}
In the message, except for the measurement name and measurement value, followers could also upload tags for the measurement. Tags allow us to associate contextual key-value pairs with collected data.
After collection, tags can later be used as dimensions to break down the data and analyze it from various different perspectives to target specific cases in isolation even in highly complex systems. More details would be discussed in the demo part.
Moreover, the protocol defines the message exchange pattern between leader and follower nodes: Every time after a follower node sends a data request to the leader node, it must wait for the positive response from leader node to send another data request. With exponential backoff mechanism, the flow condition in the system could be controlled to some extends. There’s also a predefined timeout after certain times of retries.
System Configuration
Configuration for the system II is very similar to the one in the System I. The only difference is the first step.
cd $(go env GOPATH)/src/github.com/census-ecosystem/oepncensus-experiments/go/iot/protocolSystem Demo
In the System II, we also collect the temperature but there is large change in the StackDriver end.
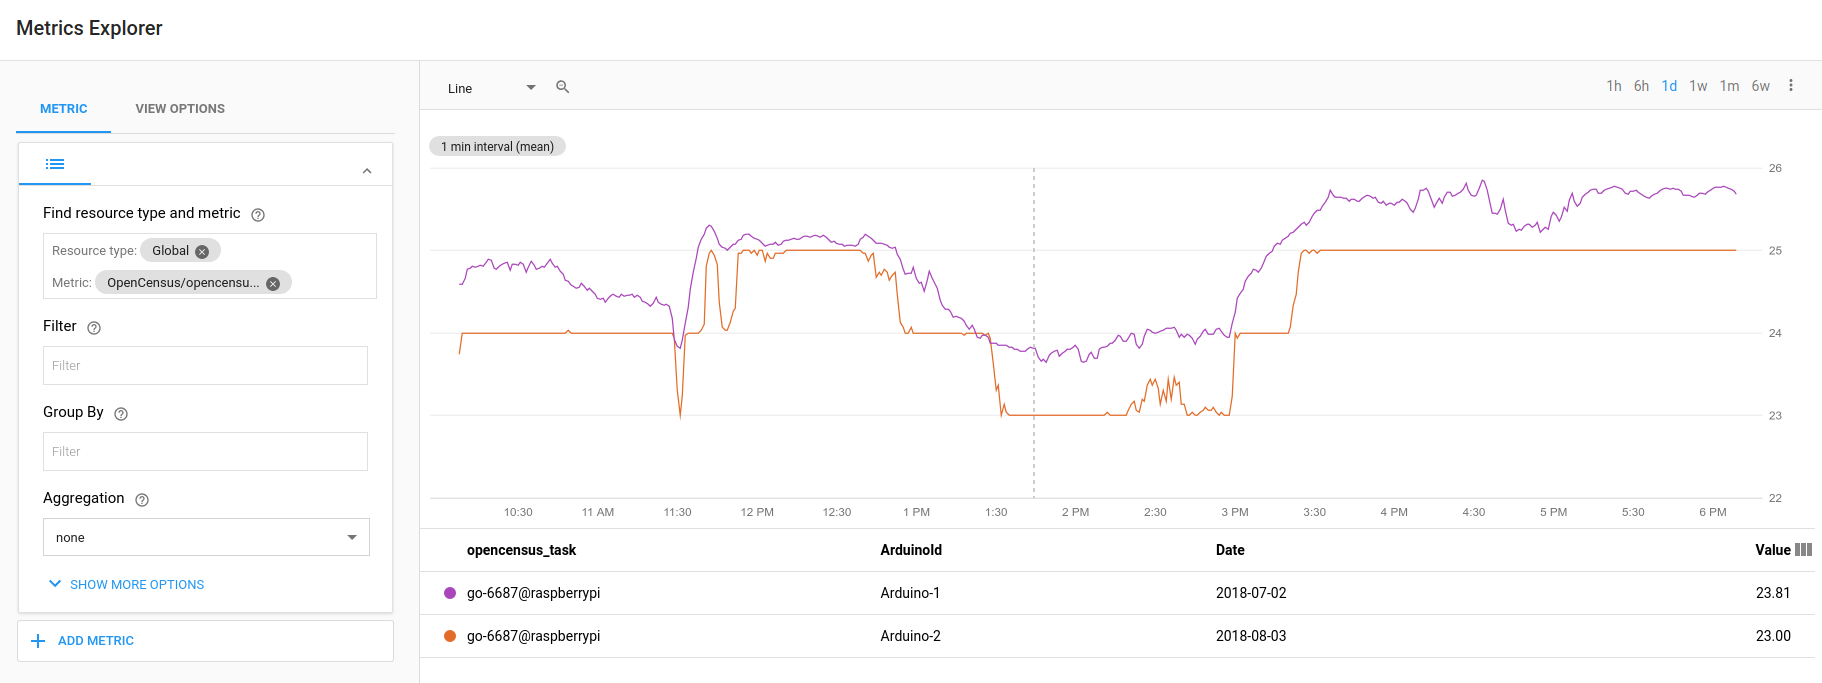
The graph above looks very similar to the graph we get in the first system. However, we could use Filter or Groupby method provided by the StackDriver to select the data source based on the tag uploaded by the follower nodes.
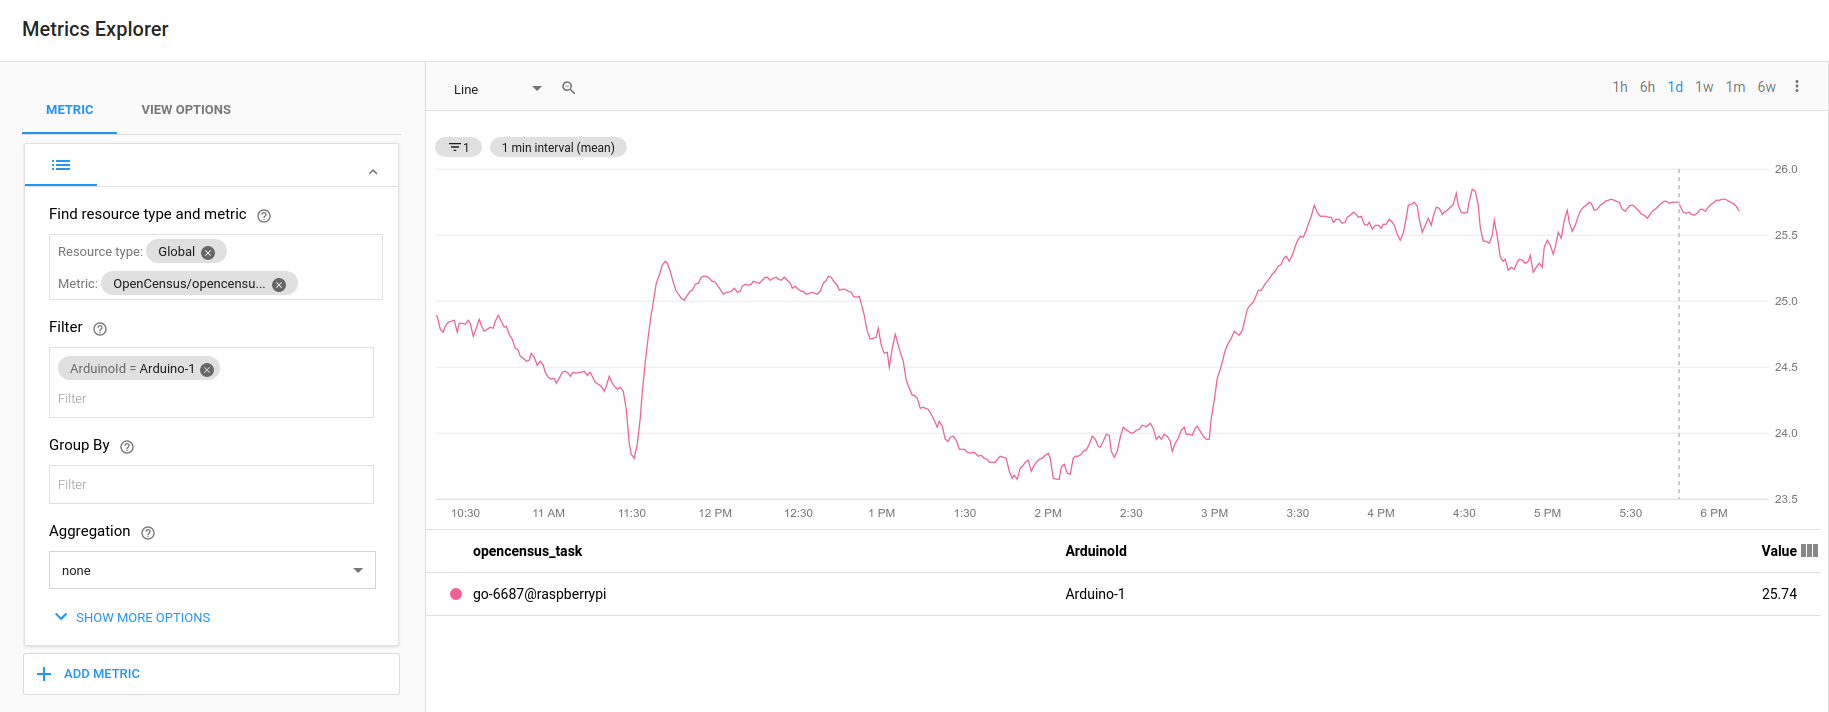
Using the Filter method in the left column, we could select the data source from one of the Arduino.
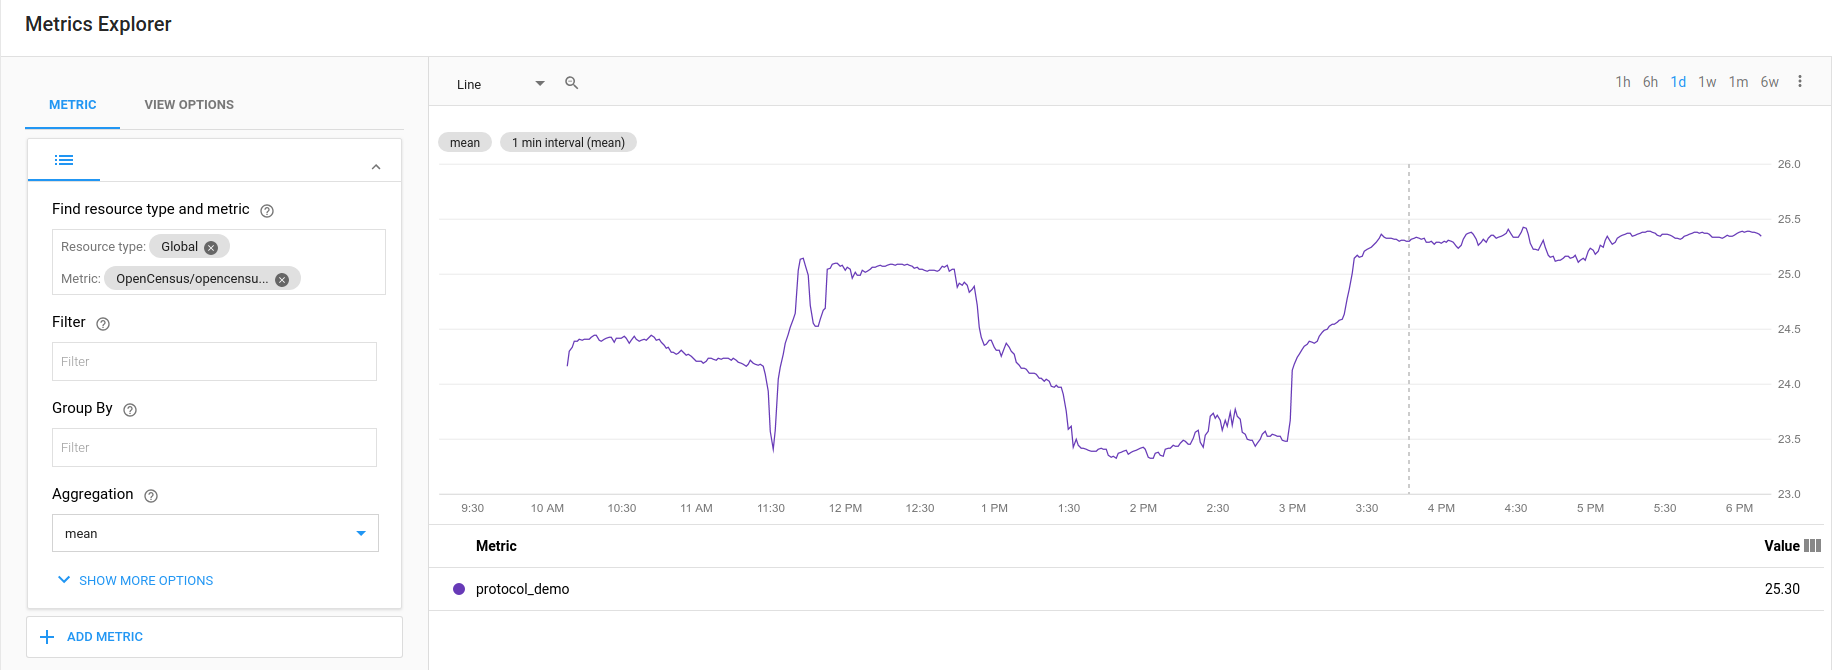
We could also use the Aggregation method to aggregate two data sources. With more data sources, we could be less influenced by those outliers.
Reference
All the demos and source codes could be downloaded from the link.
Acknowledgement
Big thanks Yang Song and Jaana Burcu Dogan for giving me lots of useful suggestions on the system design. Their words are really beneficial for my future career;
Ramon Nogueira, Pritam Shah for the reviews and fund supports on devices, and also to every one on the OpenCensus team for all their hard work!
By Peiqin Zhao, Google, LLC.