Incident Debugging Workflow
Using OpenCensus to monitor application health and debug latency issues
- Introduction
- Workflow
- Instrument your Application
- Setup Backends for Monitoring Metrics and Trace Data
- Respond to alerts
- Iteration
- Resources
Introduction
This page explains the workflow for use of OpenCensus for continuous monitoring of application health and for troubleshooting latency issues. To ensure availability to users, applications should be instrumented with monitoring metrics to track operational health. When a problem is detected then you can use metrics, traces, logs, and other tools and artifacts to find the source of the problem. The example web application from the Go HTTP Integration Guide will be used with Prometheus and Zipkin to demonstrate the concepts discussed. The concepts apply to all languages as well as other monitoring metrics and trace backends. After reading this page you should be able to formulate an approach to detect a problem with your application before the majority of your users experience it and identify the source of the problem systematically.
Workflow
A summary of the workflow is:
- Instrument your application for metrics, tracing, and logging (note: logging is not currently included in OpenCenus)
- Set up a metrics backend and dashboards to continuously monitor performance.
- Respond to alerts when they are triggered, identifying the source and correcting problems.
- After recovery, assess how effective your instrumentation was and refine it as necessary.
Instrument your Application
Before releasing an application to production you should consider how you are going to maintain its operational health and investigate user reports of problems with the application. The operational health is most often tracked with monitoring metrics that reflect user experience. Monitoring metrics are most useful for this purpose because their aggregated form can be used to provide a continuously monitored time series. Error rates based on HTTP return codes and latency for web applications are common examples that OpenCensus can support through OpenCensus’ HTTP integrations. In addition, take advantage of other OpenCensus integrations to minimize the amount of custom code necessary for this task and to leverage the experience included in these integrations. Add tracing and logging for identification of the sources of issues with specific requests. See the OpenCensus Quickstart for the language that your application is developed in to get started doing this.
Setup Backends for Monitoring Metrics and Trace Data
Backend monitoring and trace systems support storage of data, visualization, and alerting. Use one of the OpenCensus Exporter libraries or Service Exporters to export the metrics and trace data to. In our example we will use the Go HTTP server application with metrics exported to Prometheus and trace data exported to Zipkin. The example application starts a Go httptest server which sends a variable sized payload back to a client also contained within the same program. It is a simple and self contained application that we can use to demonstrate the basic concepts discussed.
Consider how you might detect a problem before the majority of your users experience it. Decide on a Service Level Indicator (SLI) that reflects the overall health of the application and a Service Level Objective (SLO) that reflects the amount of downtime that you aim to support. A common SLI is the error rate of HTTP requests. The dashboard for the SLI of your application should be well known and viewed frequently.
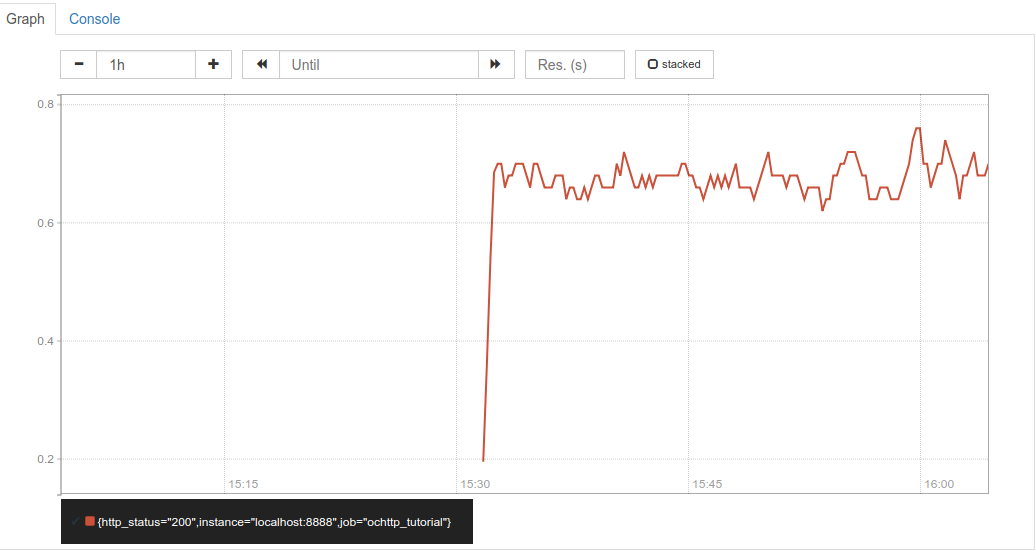
In our example application we can create a chart with HTTP request rate with a Prometheus query like
rate(ochttp_tutorial_opencensus_io_http_server_response_count_by_status_code[1m])
This query returns the rate of HTTP requests broken down by response code over 1 minute intervals. A screenshot of the chart displayed in Prometheus is shown below.
One way that we can normalize request rate to an SLI that is easy to relate to an SLO is to divide successful requests by total requests:
SLI = QPS_200 / QPS
Where QPS_200 is the rate of HTTP requests with a successful response code and QPS is the total request rate. We can implement this with the Prometheus query shown below over 1 minute time intervals.
rate(ochttp_tutorial_opencensus_io_http_server_response_count_by_status_code{http_status="200"}[1m])
/ rate(ochttp_tutorial_opencensus_io_http_server_response_count_by_status_code[1m])
If 100% of requests received are returned with successful responses then we will call that good. Since our example application only returns successful requests then we do get a 100%, as shown in the screenshot below.
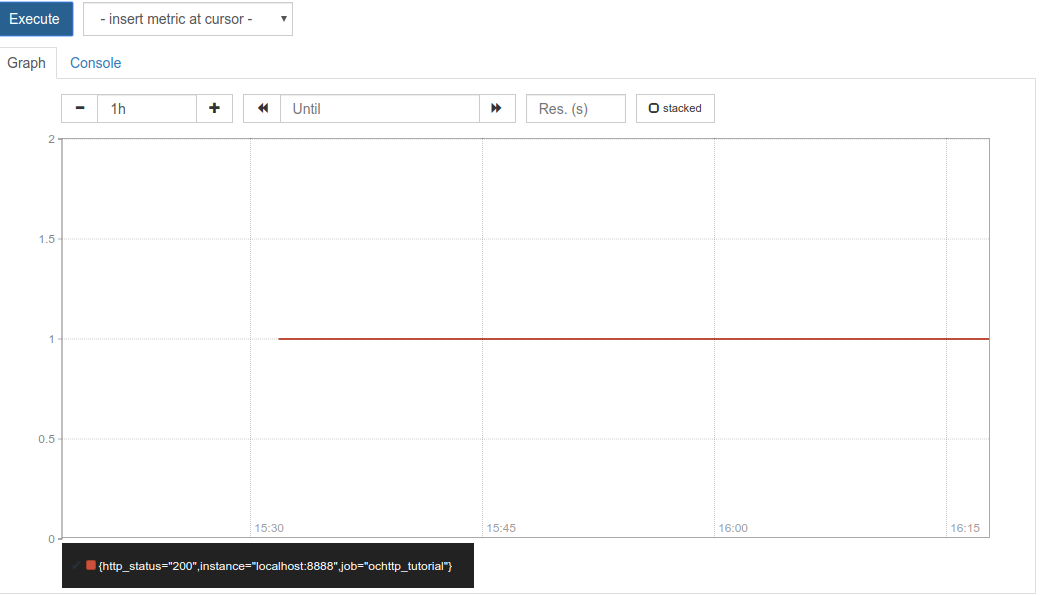
It is a very boring chart and we like that because it means that everything is OK. But what if everything is not OK? How much ‘not OK’ can we tolerate? Let’s say that we can tolerate 0.1% errors. That is, if we have greater than 99.9% of requests returned successfully then we are within SLO. This SLO is very simple and has a number of problems. For example, what if the requests never arrive at our server due to a network problem or take so long to return that our users give up and stop using the application? The SLI that we just defined does not cover these cases. Are we willing to tolerate 1 in 1000 responses resulting in an error? It may be ok if we have a retry that is not apparent to the user but not if the initial error is exposed directly to the user. An alternative to using server side measurements for an SLI is black box monitoring with, say, a HTTP probe. Consult the SRE book for a deeper discussion on the issues involved.
Respond to Alerts
Configure alerts to ensure that you know when your application becomes unhealthy as indicated by a violation in SLO. In our example, you could set up Prometheus alerts. You will probably want to page an oncall responsible for your application if you go out of SLO using integration with a paging system, such as PagerDuty, and a messaging system, such as HipChat. Fast response to an SLO violation is critical if you want to achieve a rapid time to recovery. However, you may have hundreds or thousands of other metrics that are also monitored and possibly alerted on. The alerts that are not SLO violations can be recorded in an alert database without necessarily paging. So, you will get paged to your cell phone for an SLO violation, which lets you know that you need to get to a keyboard quickly. From your workstation you may access the array of data needed to begin identifying the source of the problem.
The various charts that you create should be able to answer the question of the scope and severity of the problem. It will be important to communicate that information to your stakeholders in an incident so that they do not get it solely anecdotally from end users.
Let’s revisit the initial question of how to detect a problem before the majority of your users experience it. If an SLO violation occurs then users are already experiencing a problem. To detect an SLO violation before users experience it then we can do one or more of:
- Use a shorter time window for alerting than for expressing the SLO
- Alert at a lower threshold than the SLO
- Add alerts for more metrics than just the just the SLI
It may take tuning and experience to get this right. See Iteration section below.
Identifying the Source of the Problem
You should use as many sources of information as possible in troubleshooting. Metrics and tracing are the focus of this page but you should also use log information and data on configuration settings, and source code changes for recent deployments as well.
Using Monitoring to Debug Problems
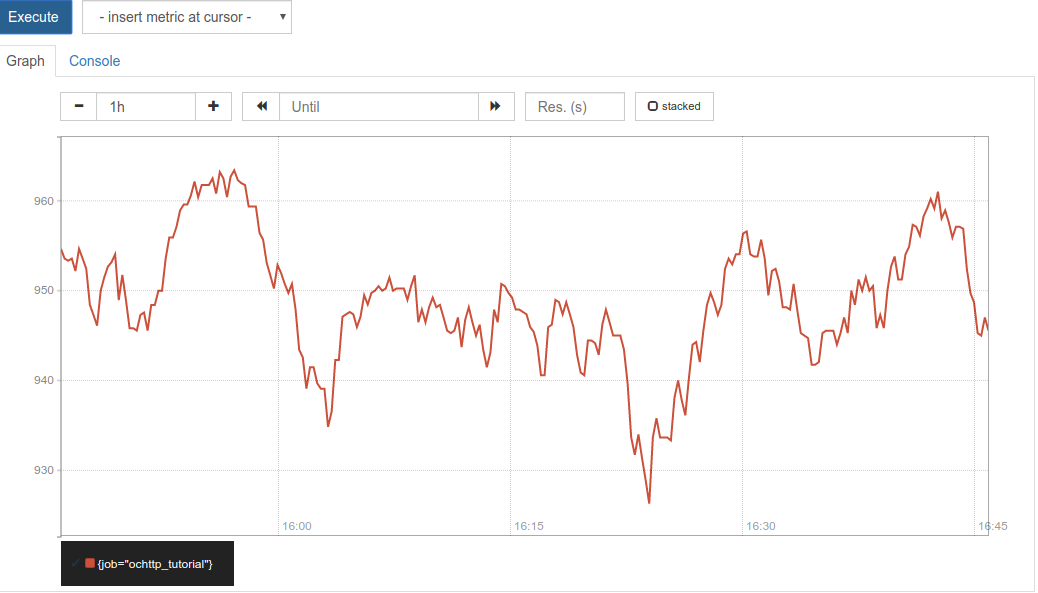
You will want to set up a number of charts grouped into dashboards so that when a problem occurs you can quickly browse over them to get a detailed picture of the health of your application. One basic indicator is the HTTP latency, which you can query in Prometheus at different percentiles. For example, you can query the 95th percentile with the Prometheus query below:
histogram_quantile(0.95,
  sum(rate(ochttp_tutorial_opencensus_io_http_server_latency_bucket[5m])) by (job, le))
A screenshot of a chart based on this query for our example application is shown below.
To support narrowing down causes in a debugging activity, consider using percentile aggregates and Tags. Changes in percentile aggregates can indicate when a part of the system is unhealthy or a problem happens only occasionally. For example, suppose you are using a content delivery network (CDN) and one of the 100 geographically distributed caching locations becomes unavailable. You might miss this in a median aggregation of the data but you would see it a 99th percentile aggregation. If you added tag values for the metric then that may tell you the specific caching location that is unavailable.
Correlation of multiple metrics time series can identify many classes of problems. For example, suppose that we see the latency rise after deployment of a new version of the application. That might correlate with a change in behavior in another metric that more directly points to the source of the problem. For example, latency is often related to payload size. The following query computes the median payload size of HTTP responses over 5 minute intervals:
histogram_quantile(0.5,
	sum(rate(ochttp_tutorial_opencensus_io_http_server_response_bytes_bucket[5m])) by (job, le))
A screenshot of the chart generated in Prometheus is shown below
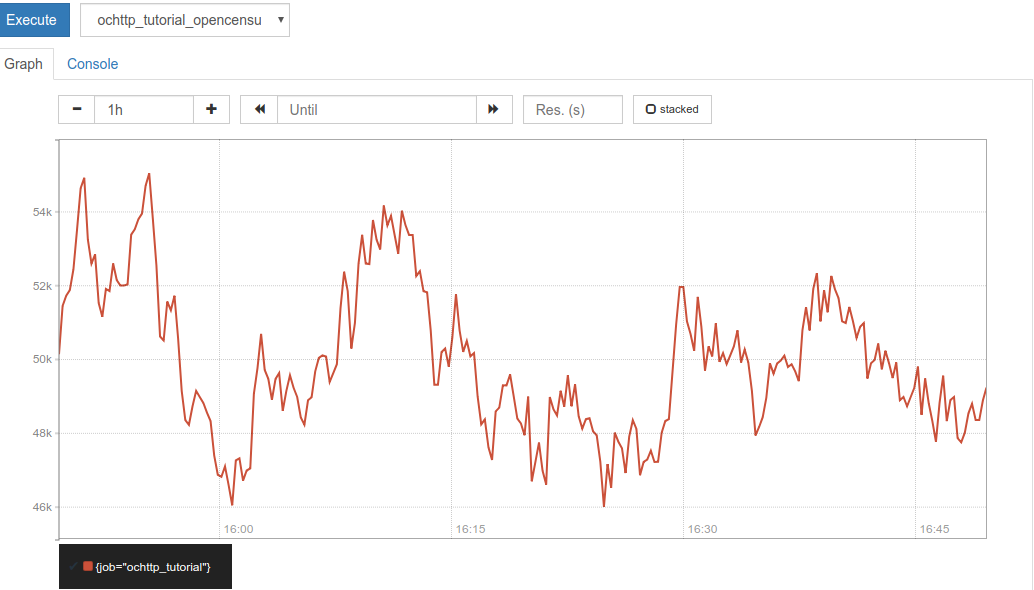
We can see that the payload size seems kind of related to the latency chart above. However, it is hard to say for sure. Part of the difficulty is that monitoring metrics are aggregated and do not give data for specific requests. We need to use logs and tracing to look at specific HTTP requests. Still, monitoring metrics are often best for tracking quantities other than latency. Metrics frequently track resources that are not captured by logging and tracing, such as CPU, memory, and network packet loss.
Using Traces to Debug Issues
The main purpose of distributed tracing is to visualize the parts of a distributed application that contribute the most to latency. You can you do a lot with tracing that you cannot do with logging and monitoring of metrics. For example, you can correlate a series of specific timing measurements and events that represent a single request. That is hard to do with logging, which captures isolated measurements or events. It is also hard to do with monitoring, which aggregates measurements from many requests together. For example, if a user request contains a remote network call to a service API that takes 10 ms and a database operation that takes 15 ms then tracing will relate those two measurements but monitoring and logging will generally only record independent measurements. However, if you add a trace ID to the logs then you can get the same results as you would with tracing correlating the different log entries belonging to the same request.
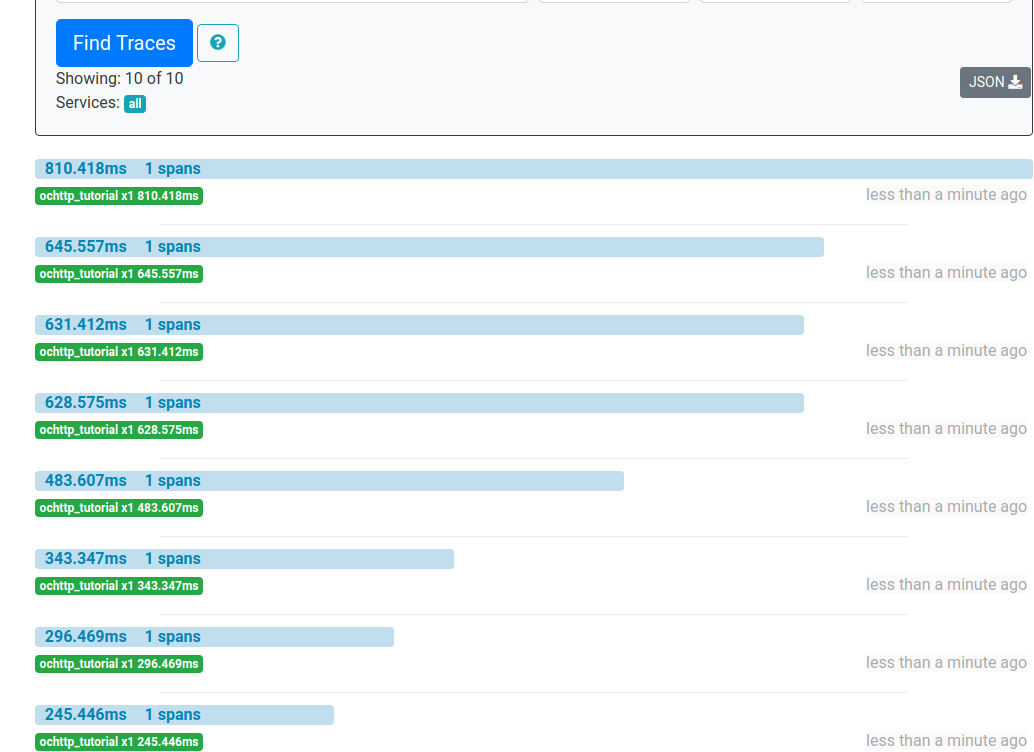
Tracing can also give annotations that indicate the source of a problem. For example, suppose that 1 in 100 HTTP requests has a high latency. By default Zipkin orders traces in by latency, as shown in the screenshot below.
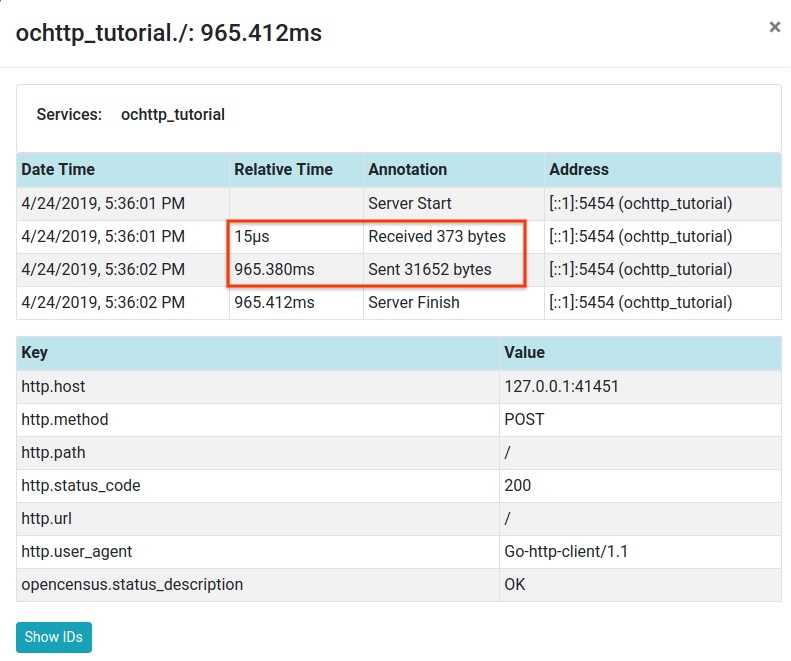
We pick the top trace because that is the one with the highest latency. We can check trace details for payload size to see if the cause of the high latency is large payload size. The screenshot below shows trace details in Zipkin with payload size highlighted.
You should configure trace sampling to be appropriate to your particular application. For example, if the traffic to your application is 100 requests per second and you hope to use trace data to debug a situation that only happens for 1 in 100 users, then it may be best to enable 100% sampling. If you are releasing a beta version of your application with relatively low traffic then a 100% sampling rate would also be appropriate. When in general availability with higher traffic then you may want to sample at a lower rate. You can also trigger sampling with a more sophisticated sampling strategy than random requests, perhaps triggering a trace on an error or high latency. The OpenCensus service collector provides advanced sampling capabilities.
See the Troubleshooting page for more examples of identification of sources of issues with OpenCensus.
Iteration
You will almost certainly not measure all the right metrics or set the right thresholds the first time around. After every outage (or near-outage) re-evaluate what you have - what signals were missing that you wished you had, did alerts fire too early or too late, what brick walls did you hit in debugging because the metrics weren’t there? Your monitoring setup should never be set in stone, but rather evolve as your service, user base, and operational understanding evolves. You should use experience during alpha and beta releases to inform supportability for a GA release.
Resources
| Resource | URL |
|---|---|
| Site Reliability Engineering book | http://shop.oreilly.com/product/0636920041528.do |
| Site Reliability Engineering book online version | https://landing.google.com/sre/sre-book/toc/ |
| Prometheus | https://prometheus.io/ |
| Zipkin | https://zipkin.io/ |
| Troubleshooting with OpenCensus | Troubleshooting |
| Available … or not? That is the question - CRE life lessons (Google Cloud Blog post) | https://cloud.google.com/blog/products/gcp/available-or-not-that-is-the-question-cre-life-lessons |