mongostatusd

Introduction
mongostatusd is a MongoDB server status daemon. It operates by fetching the status of your MongoDB server installation as per MongoDB stats.
It parses the returned stats and then exports them to any the stats backends below:
- Prometheus
- DataDog
- Google Stackdriver Monitoring
It reads its configurations for the toggled backends from a YAML file.
Installing it
Installing it requires you to have Go
With Go installed and go get properly installed, you can then do
go get -u -v github.com/opencensus-integrations/mongostatusd/cmd/mongostatusdand now you should be able to start it, but first please see Configuring it
Configuring it
It reads its configuration for the exporters as well as MongoDB server URL, in a file
saved as config.yaml, for example:
metrics_report_period: 62s

stackdriver:
    project_id: census-demos
    metric_prefix: mongostatusd

mongodb_uri: mongodb://localhost:27017
mongodb_name: test

prometheus:
    port: 8787
Running it
With the config.yaml file in the current working directory as well as the properly installed mongostatusd.
If you are unable to install Go or if your installation fails, there are binaries attached to the releases at https://github.com/opencensus-integrations/mongostatusd/releases
With mongostatusd now downloaded/properly installed and your config.yaml file in the same working directory, we can now run it as
mongostatusdSamples
On Prometheus
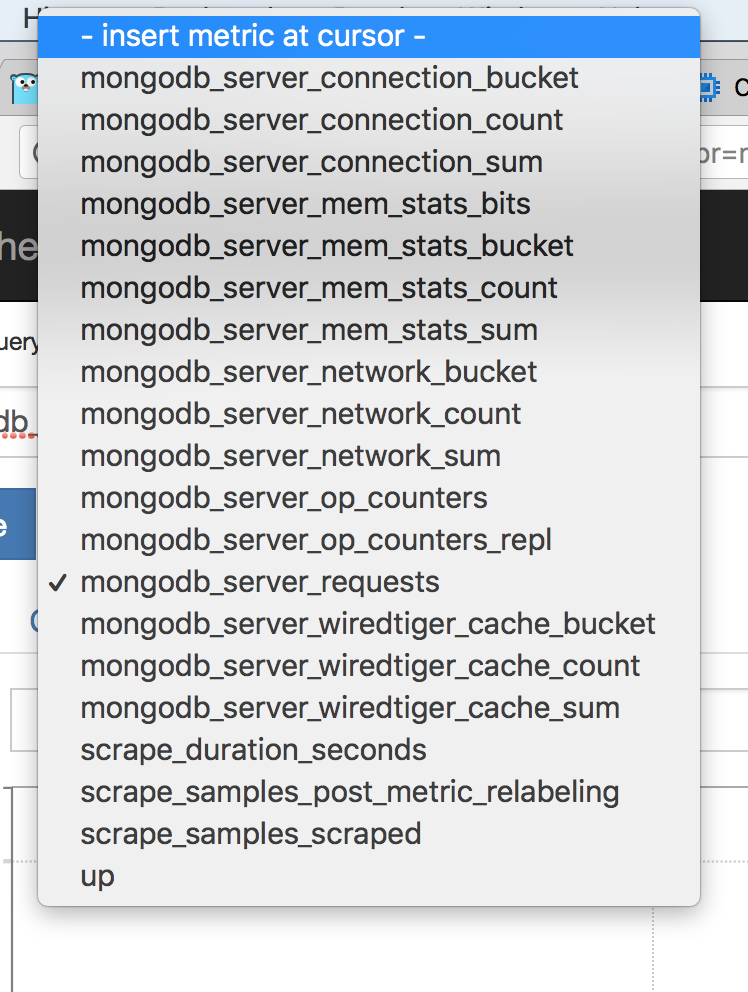
All stats
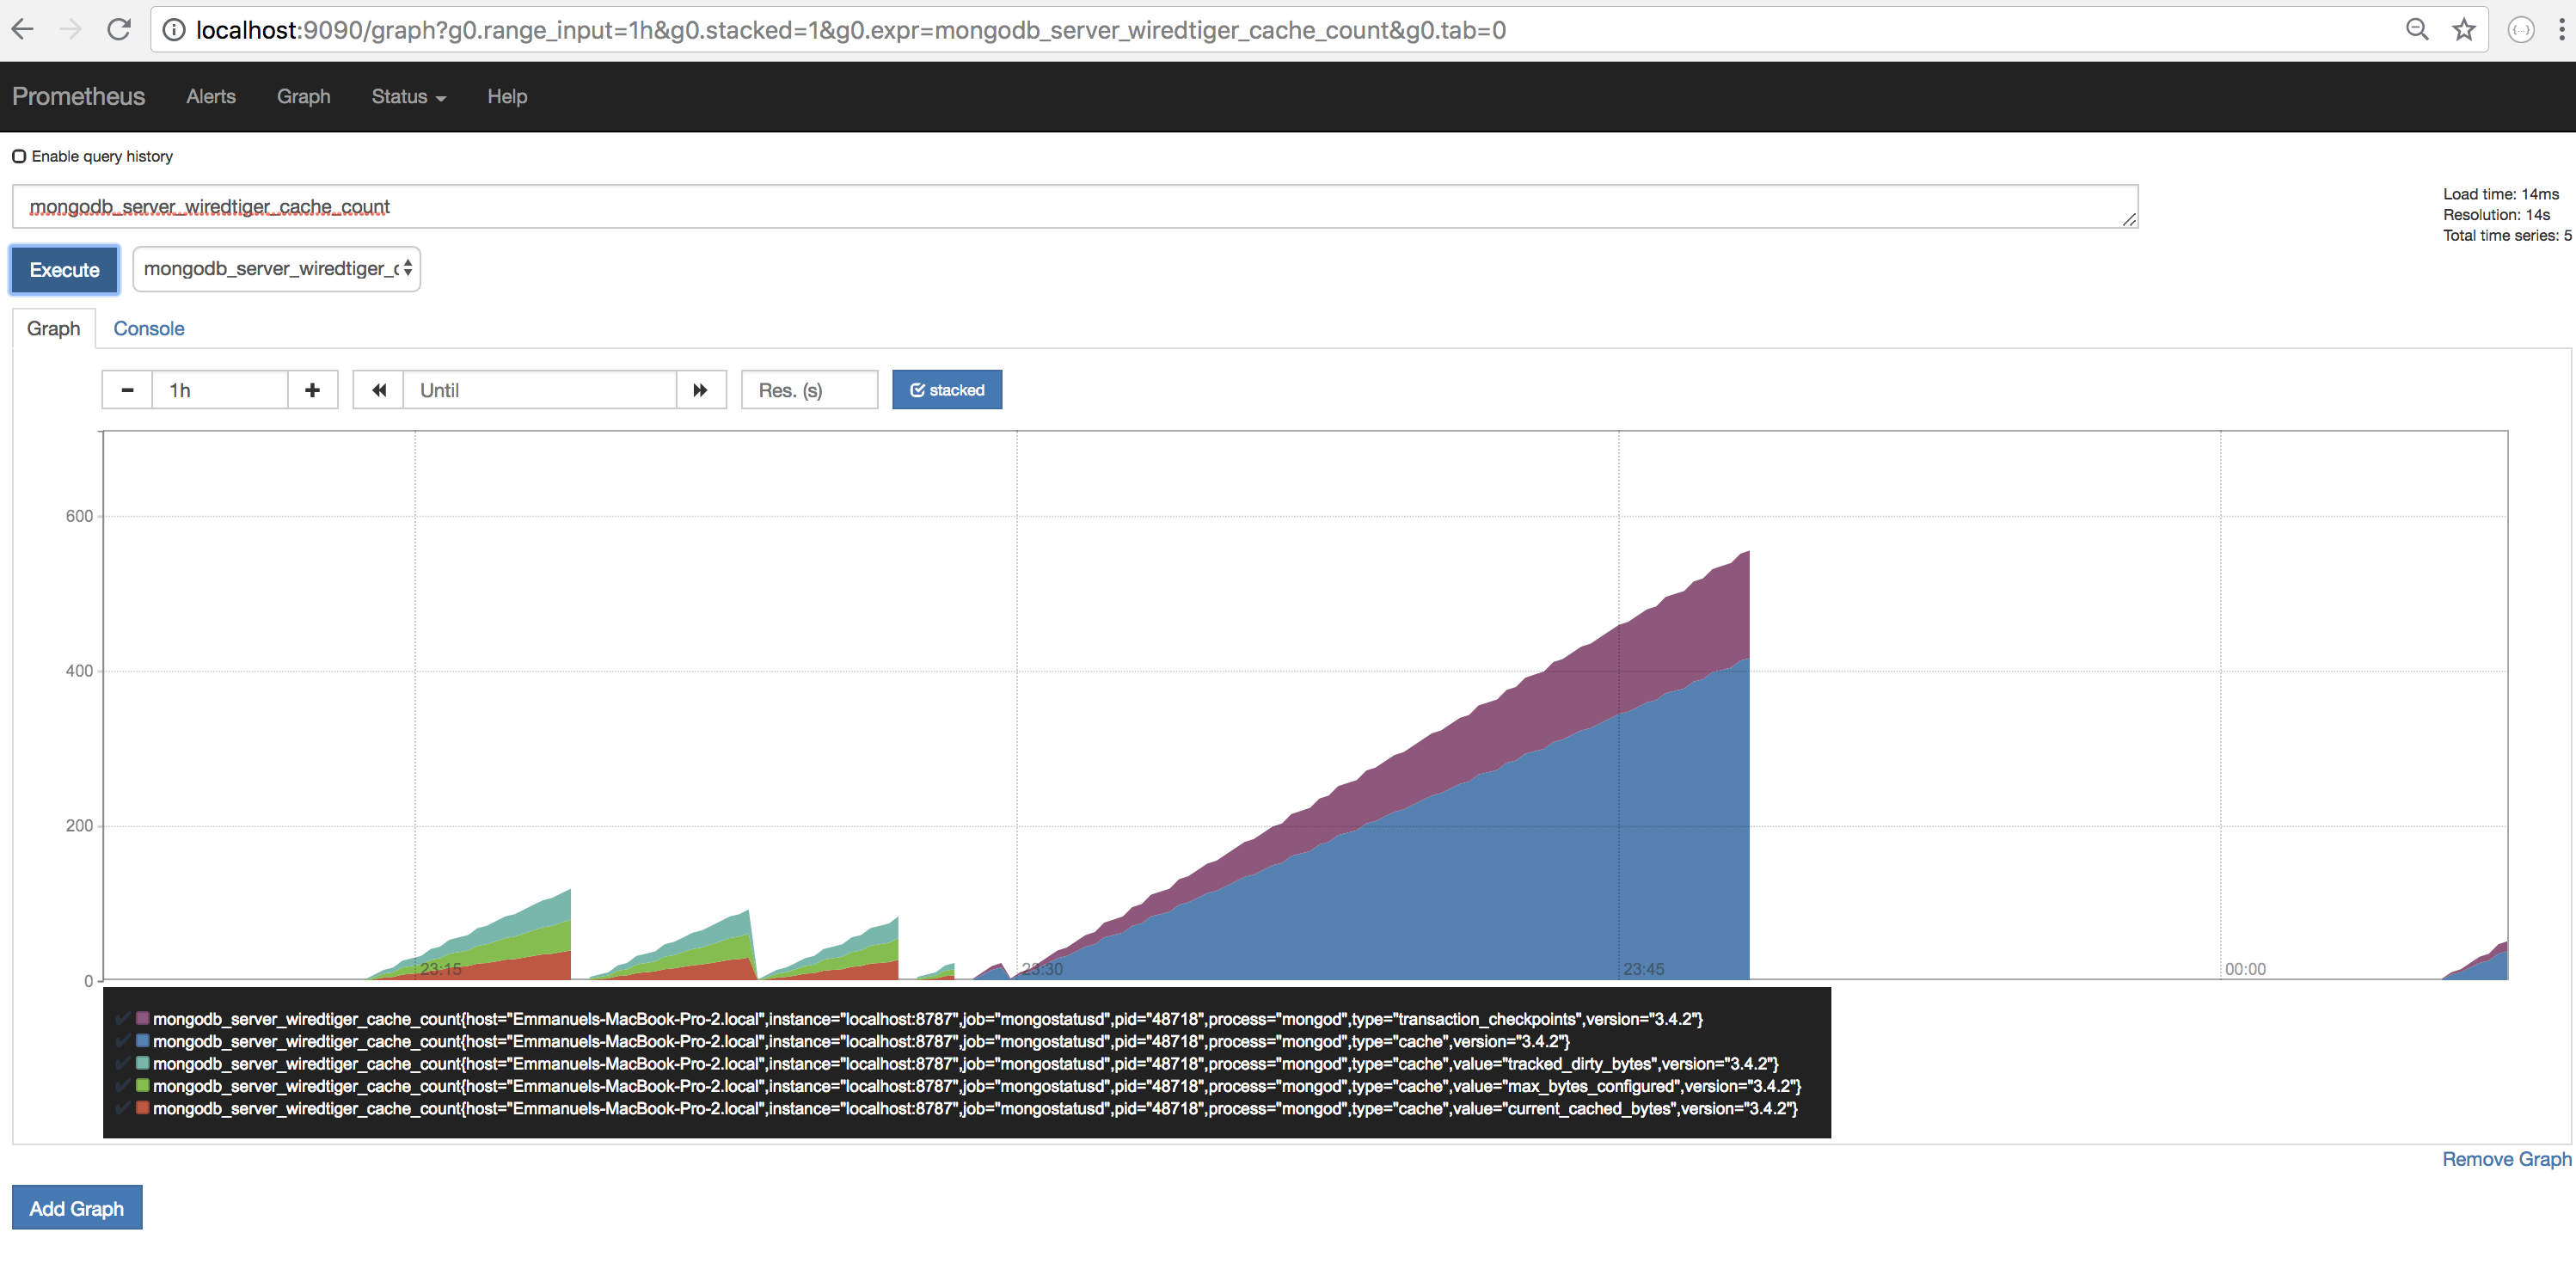
WiredTiger Cache count stats
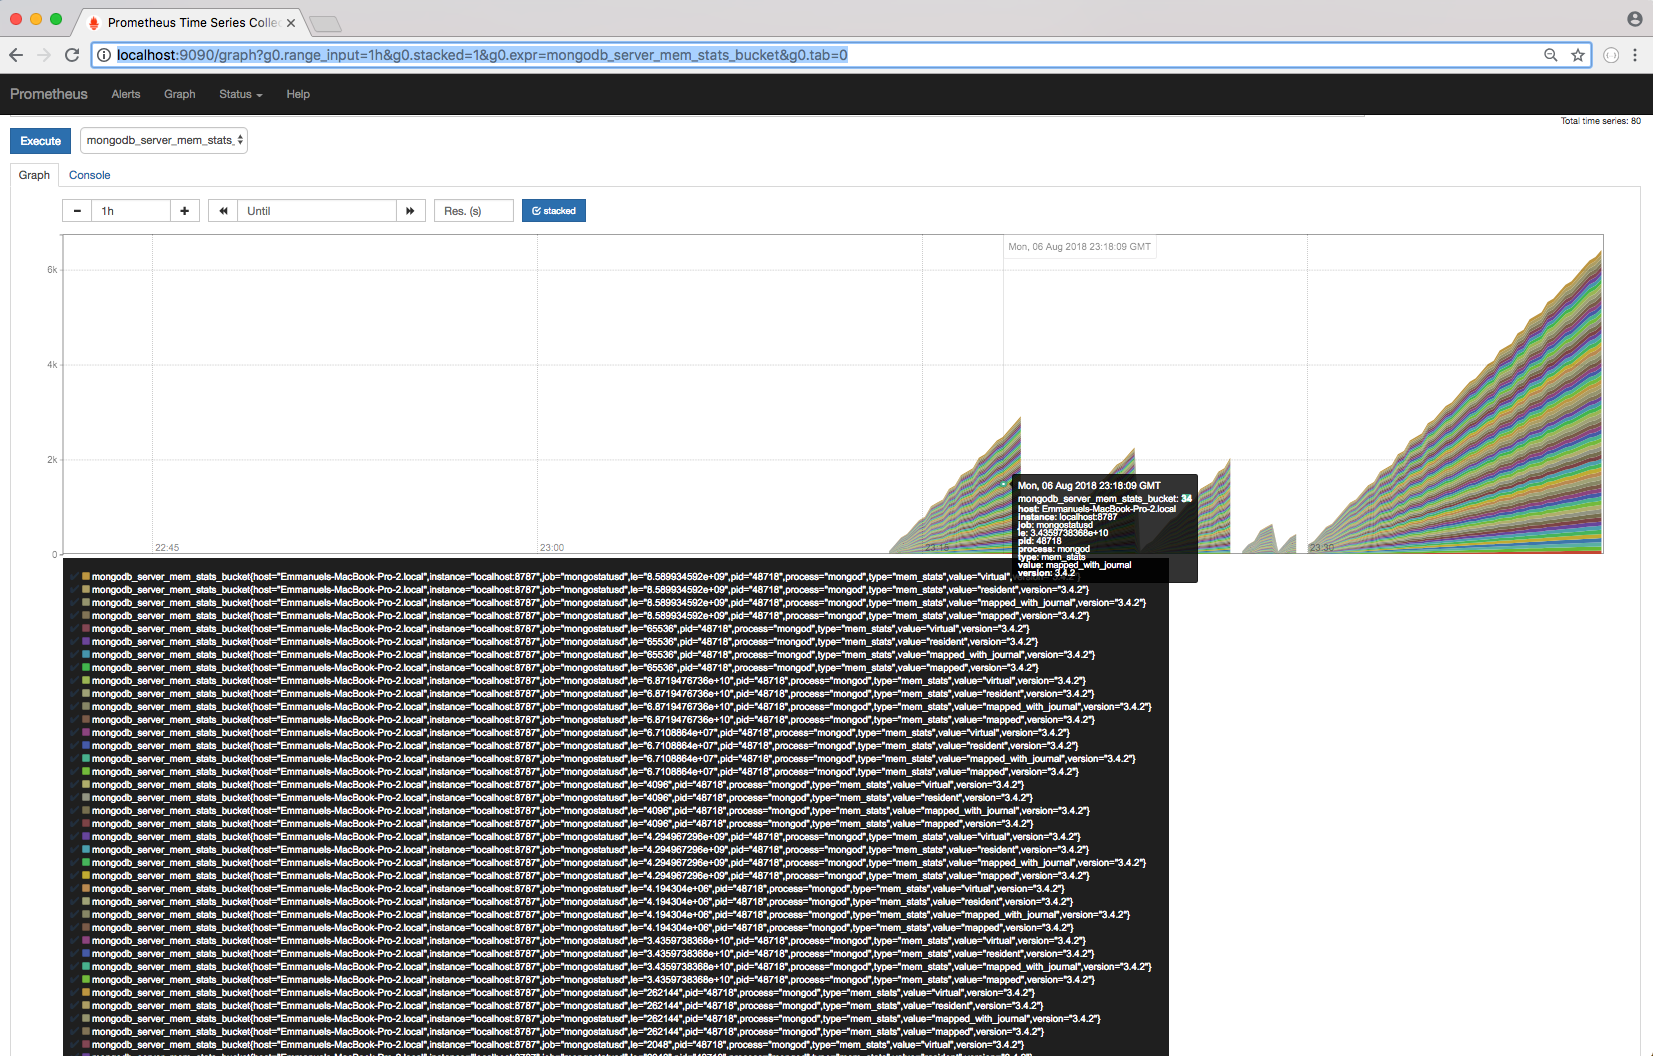
Memstats
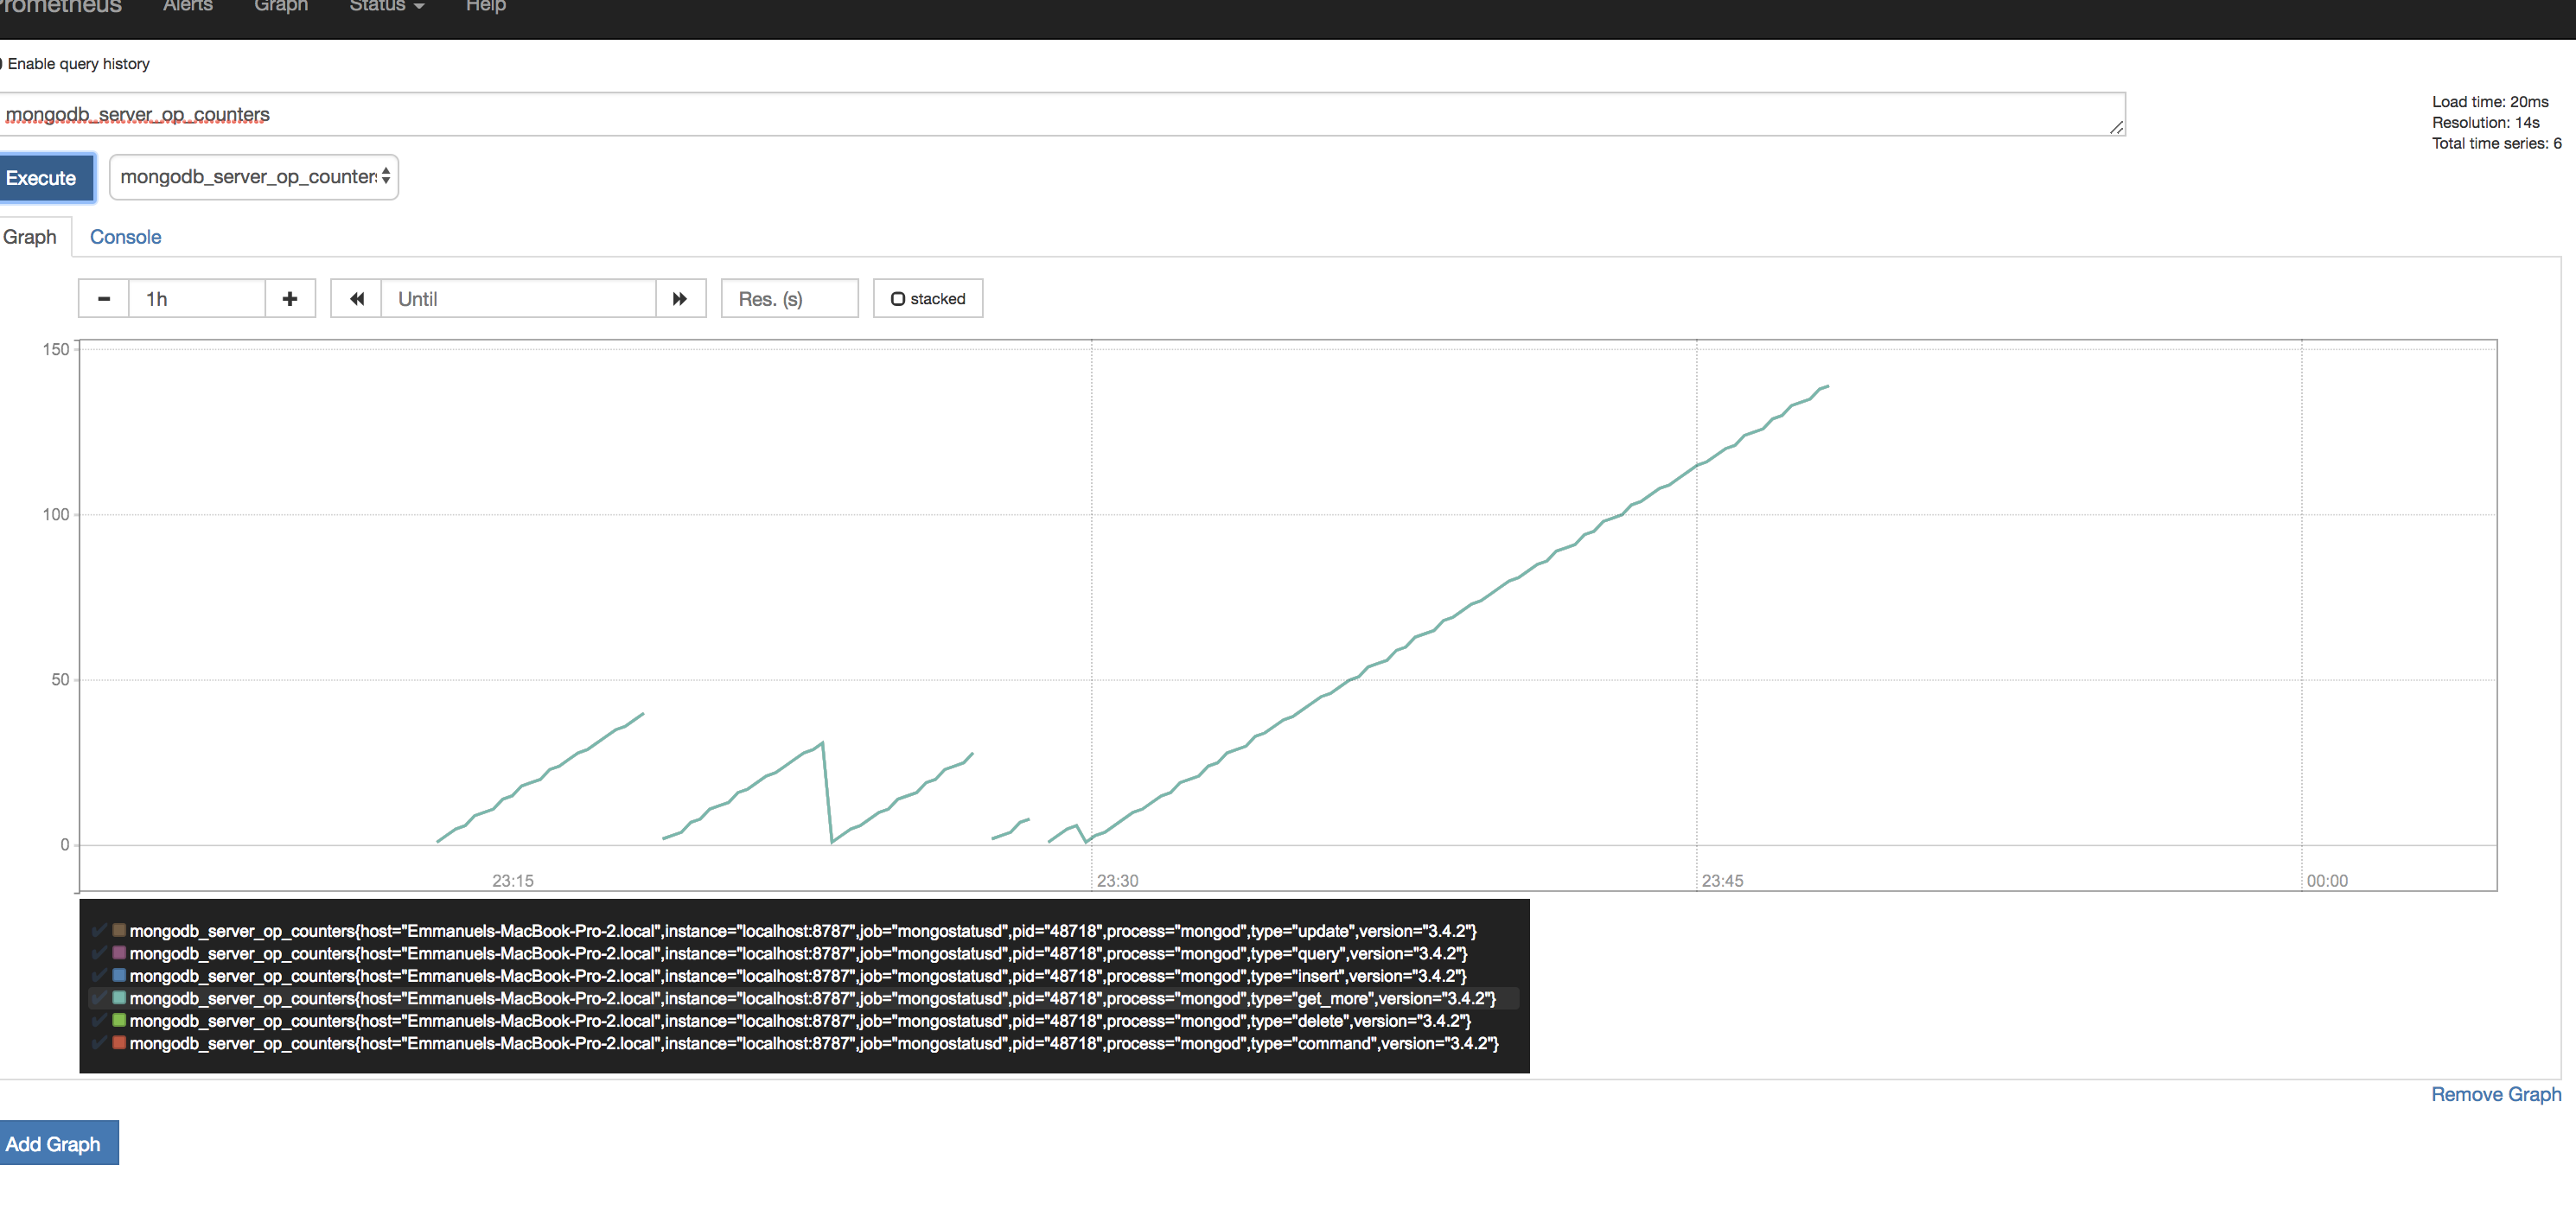
Server op counters
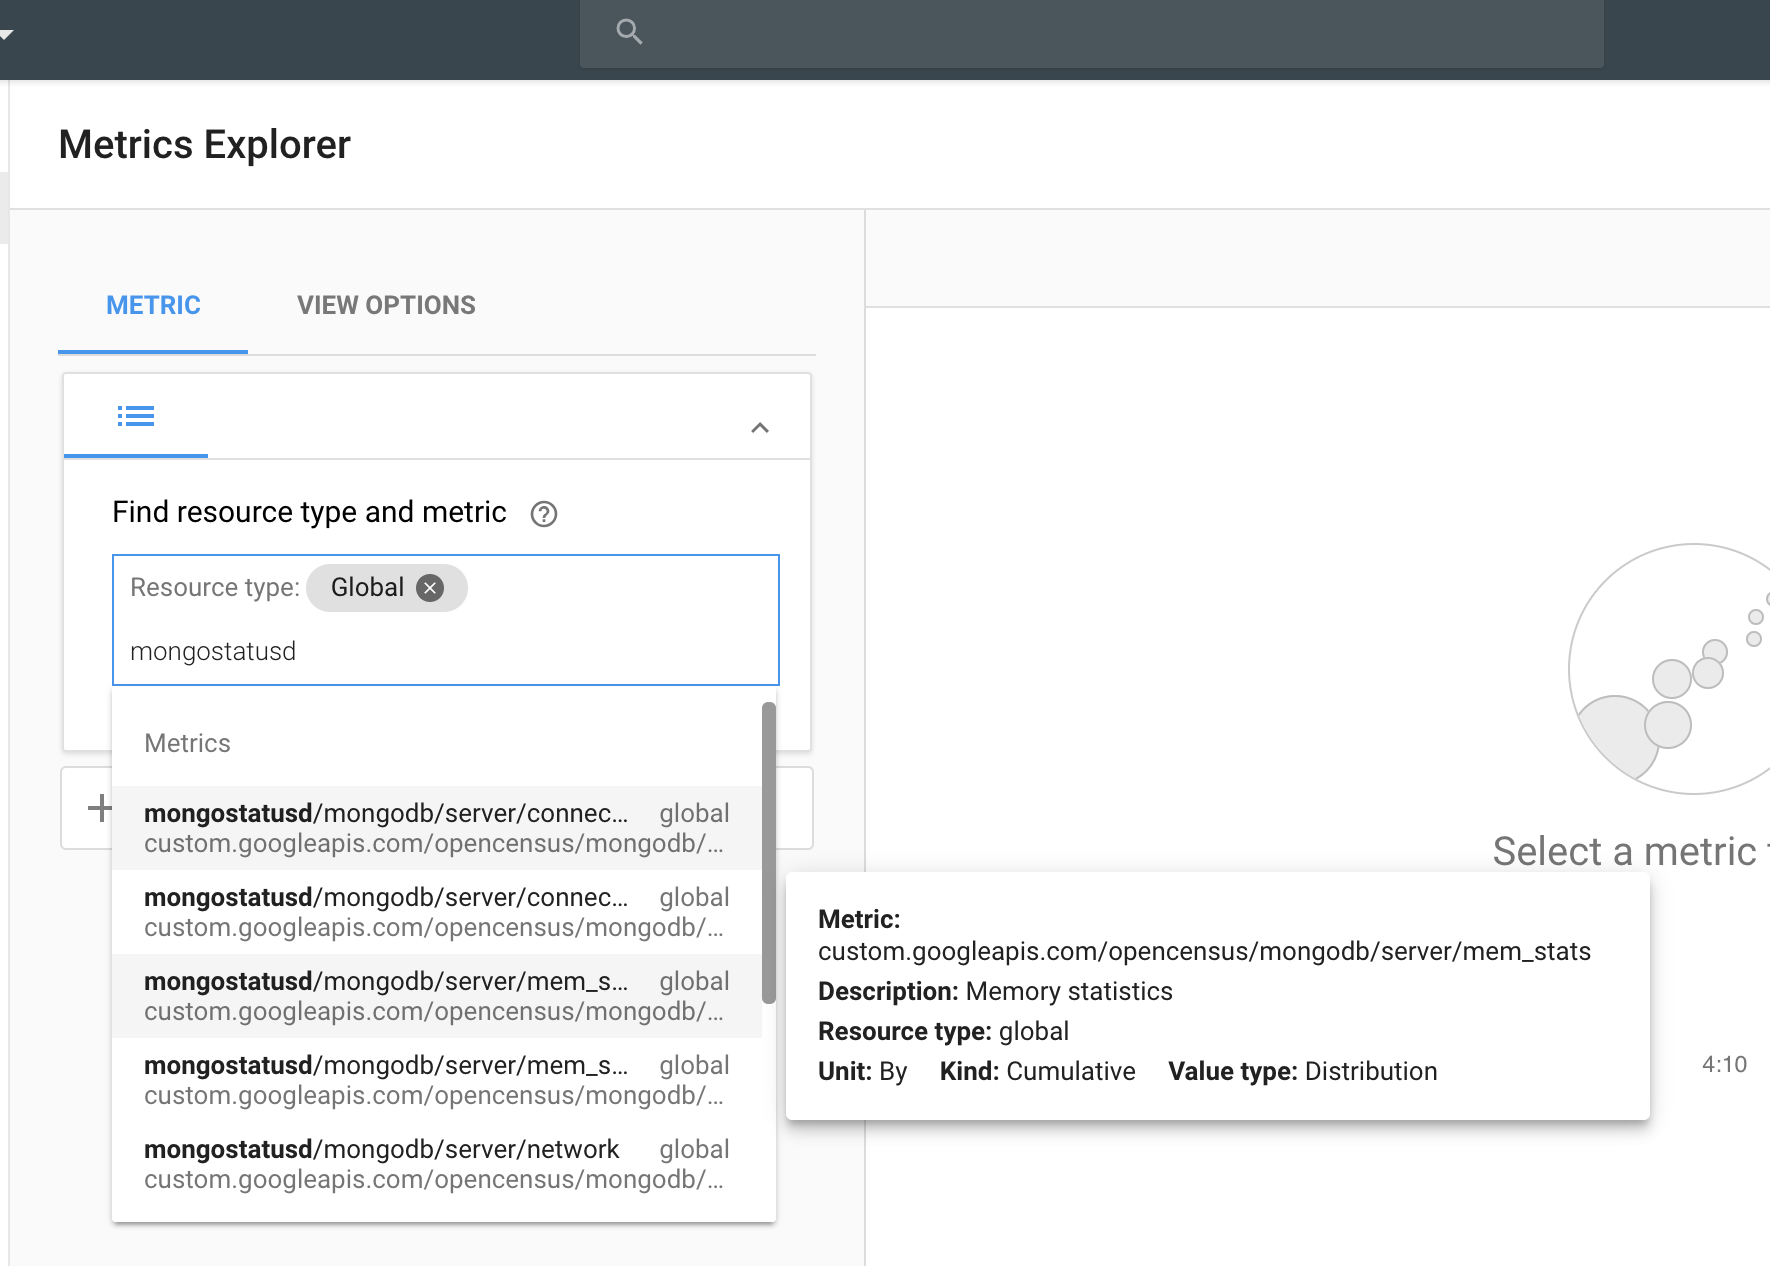
On Stackdriver Monitoring
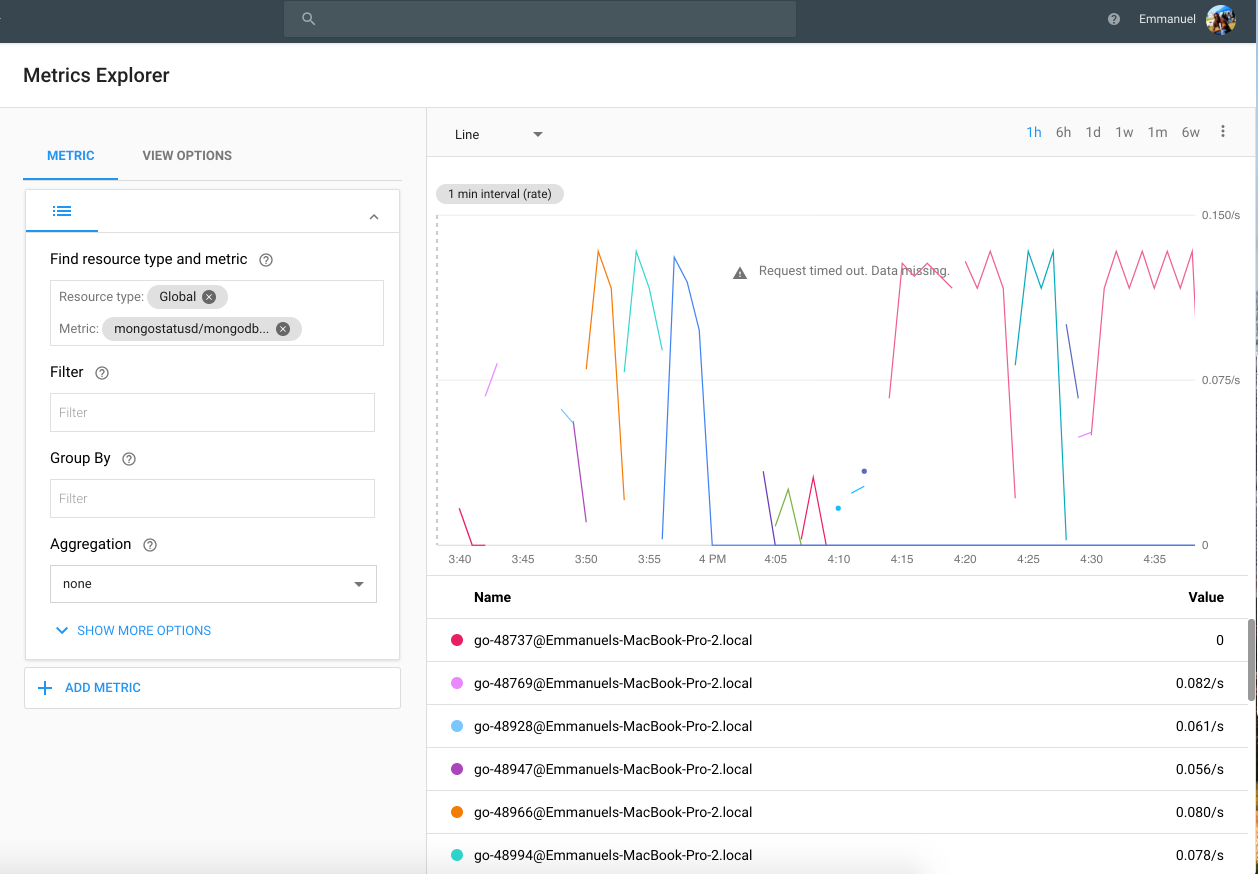
All stats
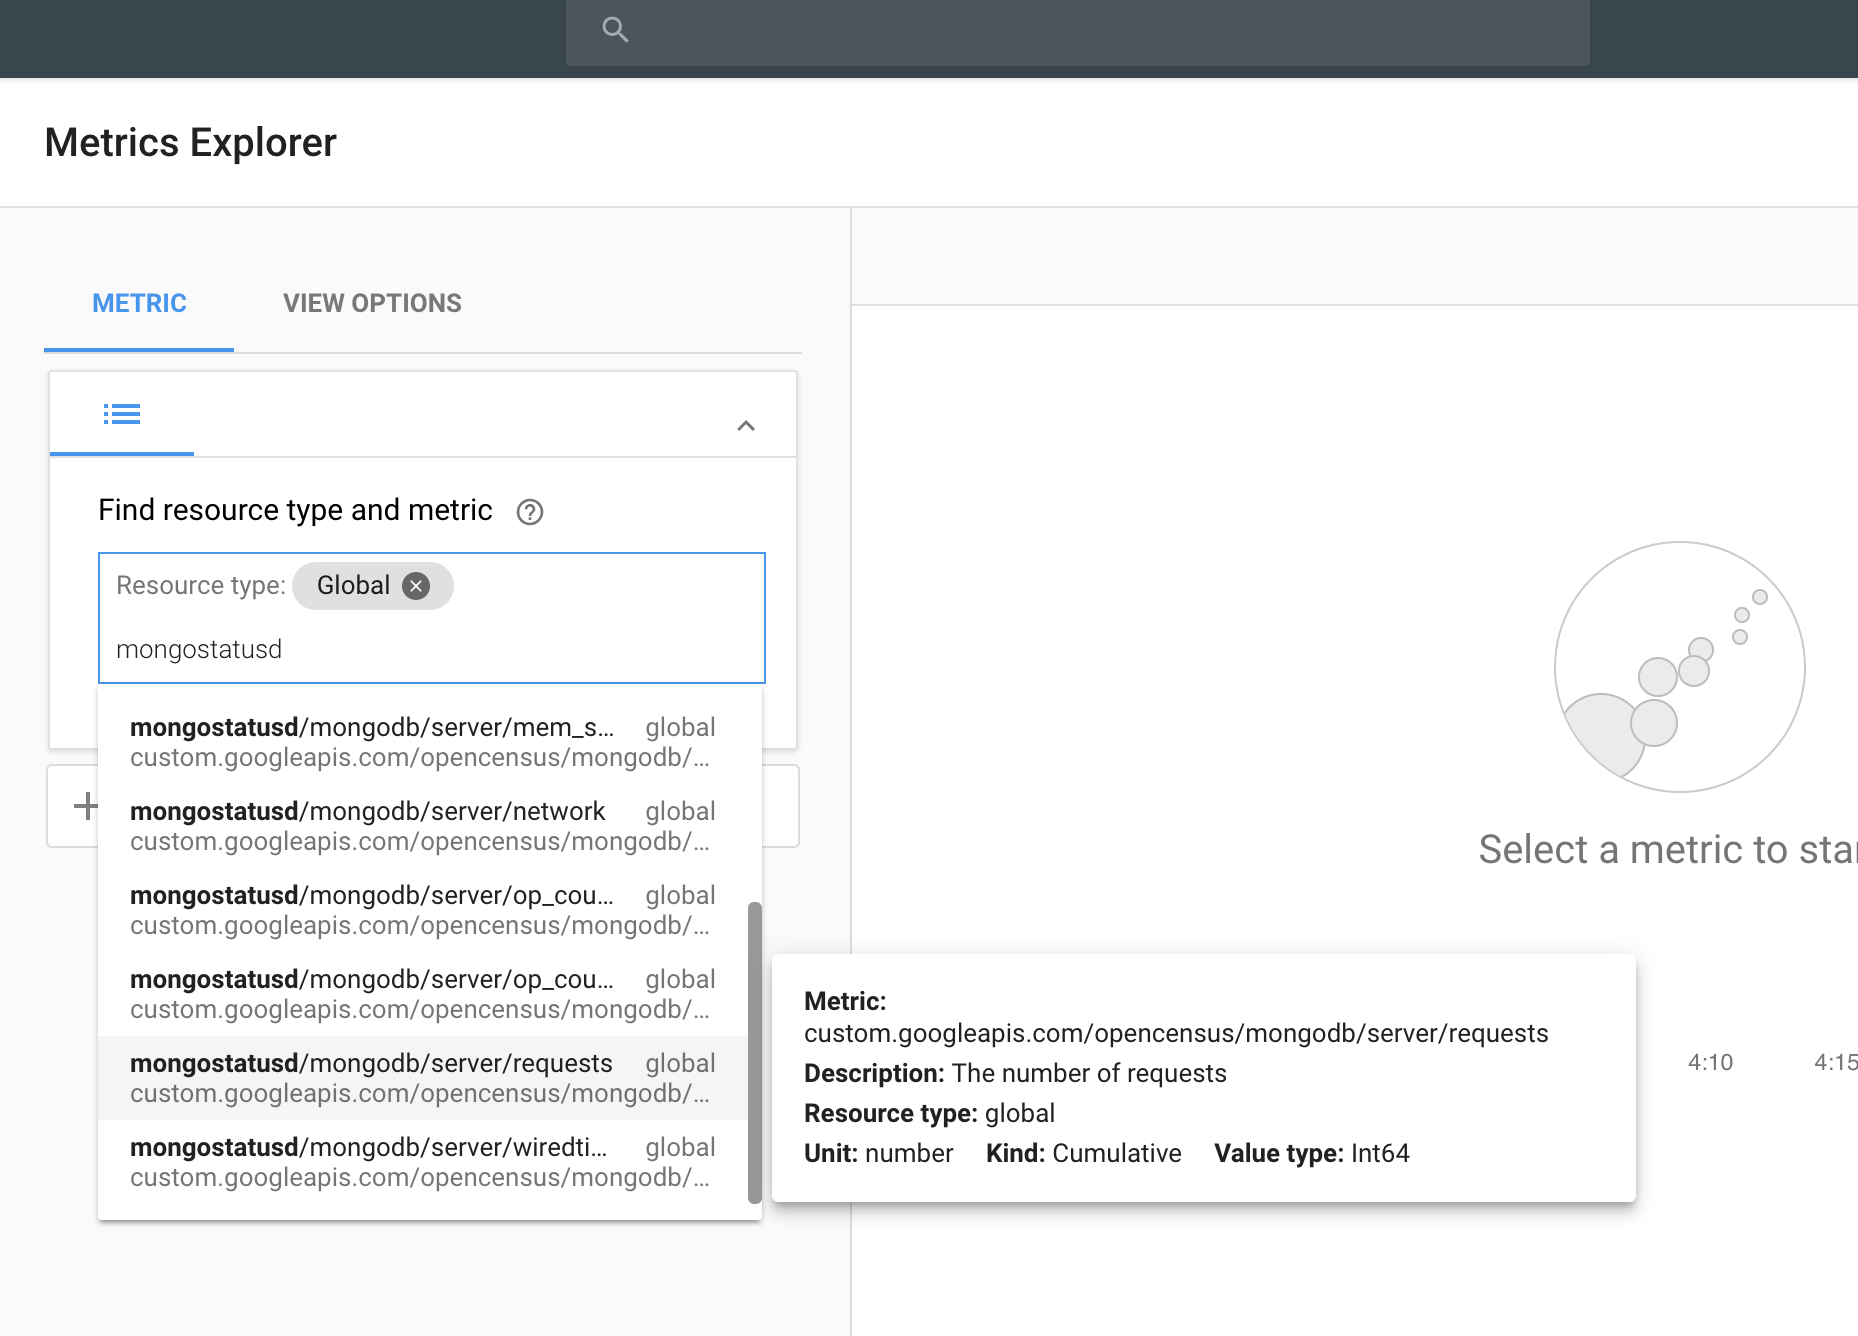
Server requests
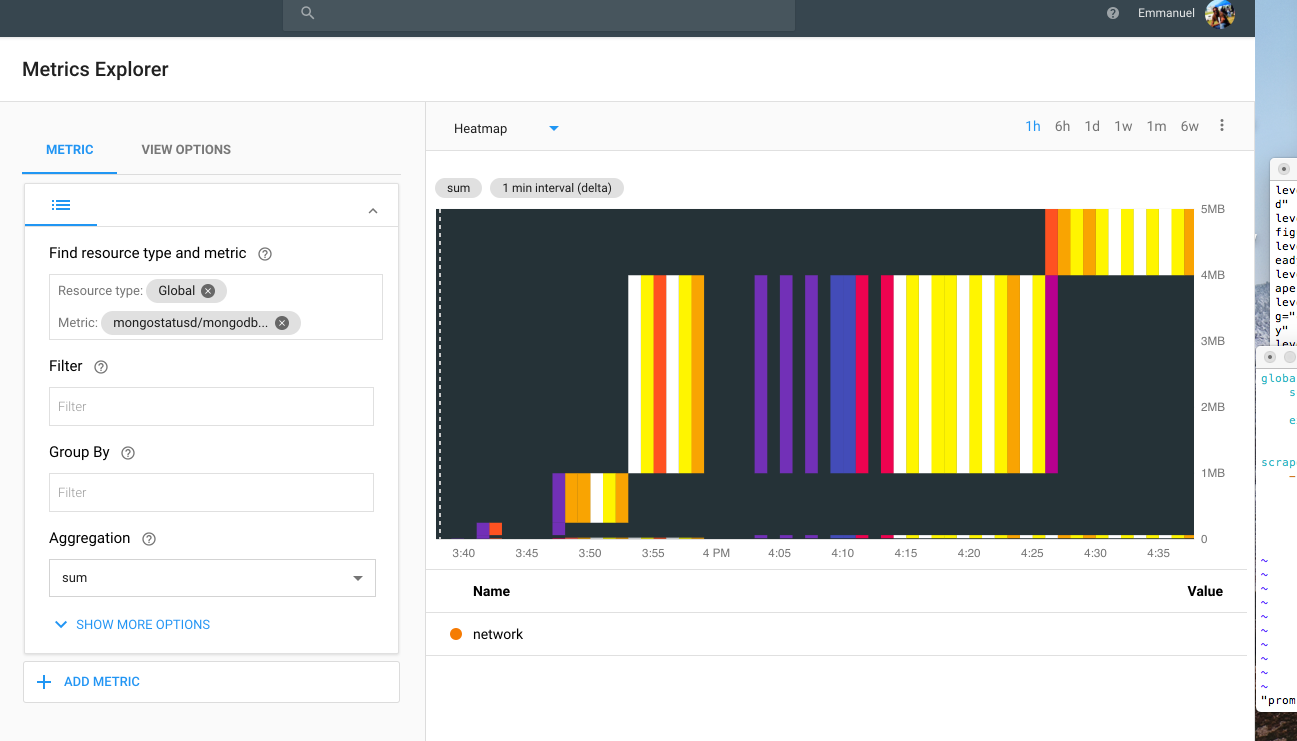
Network
References
| Resource | URL |
|---|---|
| Mongostatusd project home | https://github.com/opencensus-integrations/mongostatusd |
| Mongostatusd releases and binaries | https://github.com/opencensus-integrations/mongostatusd/releases |
| Monitoring for MongoDB | https://docs.mongodb.com/manual/administration/monitoring/ |