Java

- Introduction
- Installing it
- Using it
- Enabling OpenCensus
- End to end example
- Examining the traces
- Examining the metrics
- References
Introduction
The Java Database Connectivity(JDBC) API provides universal data access from the Java programming language as documented at https://docs.oracle.com/javase/8/docs/technotes/guides/jdbc/
Using OpenCensus, we’ve combined the best of both worlds: observability with distributed tracing and metrics to empower Java developers that use any sort of database/data source with a JDBC driver.
ocjdbc is a type-4 JDBC wrapper for the Java language. We’ve instrumented it with OpenCensus to provide
observability with tracing and metrics. It works by wrapping your already obtained JDBC Connection using
the class ocjdbc.OcWrapConnection. It wraps any JDBC driver. It is hosted on our integrations page on
Github at https://github.com/opencensus-integrations/ocjdbc
but also distributed as Maven, Gradle, Ivy and Builder artifacts as you’ll shortly see below.
Installing it
<dependency>
    <groupId>io.orijtech.integrations</groupId>
    <artifactId>ocjdbc</artifactId>
    <version>0.0.6</version>
</dependency>
// https://mvnrepository.com/artifact/io.orijtech.integrations/ocjdbc
compile group: 'io.orijtech.integrations', name: 'ocjdbc', version: '0.0.6'<!-- https://mvnrepository.com/artifact/io.orijtech.integrations/ocjdbc -->
<dependency org="io.orijtech.integrations" name="ocjdbc" rev="0.0.6"/># https://mvnrepository.com/artifact/io.orijtech.integrations/ocjdbc
'io.orijtech.integrations:ocjdbc:jar:0.0.6'Using it
Using it simply requires you to just wrap your already created JDBC connection and it wraps every method to provide observability by metrics and tracing. For example
import io.orijtech.integrations.ocjdbc.OcWrapConnection;
import io.orijtech.integrations.ocjdbc.Observability;

public static void main(String ...args) {
    // Load and use the MySQL Connector/J driver.
    Class.forName("com.mysql.cj.jdbc.Driver").newInstance();

    java.sql.Connection originalConn =
        java.sql.DriverManager.getConnection(
            "jdbc:mysql://localhost/test?useSSL=false&serverTimezone=UTC");

    // Then create/wrap it with the instrumented Connection from "io.orijtech.integrations.ocjdbc".
    java.sql.Connection conn =
          new OcWrapConnection(originalConn, EnumSet.of(Observability.TraceOption.NONE));

    // Use conn like you would normally below as per your original program
}

// Enabling observability by subscribing to the views
// and then creating the exporters is necessary too.
public static void enableObservability() {
    // Enable metrics with OpenCensus.
    Observability.registerAllViews();

    // Then create the trace and metrics exporters here
}
Annotating traces with the various SQL statements
We also provide an option for your spans to be annotated with the SQL that accompanies an exec*.
However, please note that this is optional and could be a security concern due to Personally Identifiable Information(PII) being used in the SQL query.
This option is available via TraceOption of Observability.ANNOTATE_TRACES_WITH_SQL which is passed into the constructors for:
* OcWrapConnection
* OcWrapCallableStatement
* OcWrapPreparedStatement
* OcWrapStatement
thus when used to create the wrapped java.sql.Connection:
      java.sql.Connection conn =
          new OcWrapConnection(
              originalConn,
              // And passing this option to allow the spans
              // to be annotated with the SQL queries.
              // Please note that this could be a security concern
              // since it could reveal personally identifying information.
              EnumSet.of(Observability.TraceOption.ANNOTATE_TRACES_WITH_SQL));
Enabling OpenCensus
To enable observability with OpenCensus, you need to have enabled trace and metrics exporters e.g.
import io.opencensus.exporter.trace.jaeger.JaegerTraceExporter;
import io.opencensus.exporter.stats.prometheus.PrometheusStatsCollector;
import io.prometheus.client.exporter.HTTPServer;
import io.opencensus.trace.samplers.Samplers;
import io.opencensus.common.Scope;
import io.opencensus.trace.Tracer;
import io.opencensus.trace.Tracing;
import io.opencensus.trace.config.TraceConfig;

public static void enableObservability() throws Exception {
    // Enable metrics with OpenCensus.
    Observability.registerAllViews();

    TraceConfig traceConfig = Tracing.getTraceConfig();
    // For demo purposes, lets always sample.
    traceConfig.updateActiveTraceParams(
            traceConfig.getActiveTraceParams().toBuilder().setSampler(Samplers.alwaysSample()).build());

    // The trace exporter.
    JaegerTraceExporter.createAndRegister("http://127.0.0.1:14268/api/traces", "ocjdbc-demo");

    // The metrics exporter.
    PrometheusStatsCollector.createAndRegister();

    // Run the server as a daeon on address "localhost:8889".
    HTTPServer server = new HTTPServer("localhost", 8889);
}
End to end example
In this example, we’ll just wrap a MySQL Connector/J app as below. Please place the file in src/main/java/io/opencensus/tutorial/ocjdbc/App.java. It uses exporters:
- Jaeger for trace exporting
- Prometheus for stats exporting
- MySQL server – please have one running locally or take a look at https://dev.mysql.com/doc/mysql-getting-started/en/
Source code
// Please place the file in: src/main/java/io/opencensus/tutorial/ocjdbc/App.java
package io.opencensus.tutorial.ocjdbc;

import io.opencensus.common.Scope;
import io.opencensus.exporter.stats.prometheus.PrometheusStatsCollector;
import io.opencensus.exporter.trace.jaeger.JaegerTraceExporter;
import io.opencensus.trace.Tracer;
import io.opencensus.trace.Tracing;
import io.opencensus.trace.config.TraceConfig;
import io.opencensus.trace.samplers.Samplers;
import io.orijtech.integrations.ocjdbc.Observability;
import io.orijtech.integrations.ocjdbc.OcWrapConnection;
import io.prometheus.client.exporter.HTTPServer;
import java.util.EnumSet;

public class App {
  private static final Tracer tracer = Tracing.getTracer();

  public static void main(String... args) {
    java.sql.Connection conn = null;

    try {
      enableObservability();

      // Load and use the MySQL Connector/J driver.
      Class.forName("com.mysql.cj.jdbc.Driver").newInstance();

      java.sql.Connection originalConn =
          java.sql.DriverManager.getConnection(
              "jdbc:mysql://localhost/repro?user=root&useSSL=false&serverTimezone=UTC");
      /*
      Optionally enable annotation of spans with the accompanying SQL statements.
      java.sql.Connection conn = new OcWrapConnection(originalConn,
                                 // And passing this option to allow the spans
                                 // to be annotated with the SQL queries.
                                 // Please note that this could be a security concern
                                 // since it could reveal personally identifying information.
                                 EnumSet.of(Observability.TraceOption.ANNOTATE_TRACES_WITH_SQL));
      */

      // Then create/wrap it with the instrumented Connection from
      // "io.orijtech.integrations.ocjdbc".
      conn = new OcWrapConnection(originalConn, EnumSet.of(Observability.TraceOption.NONE));
      doWork(conn);
    } catch (Exception e) {
      e.printStackTrace();
      System.err.println(String.format("Failed to create SQLDriver: %s", e));
      return;
    } finally {
      // Finally close the connection when done.
      if (conn != null) {
        try {
          conn.close();
        } catch (Exception e) {
          e.printStackTrace();
          System.err.println(String.format("Failed to close conn: %s", e));
        }
      }
    }
  }

  public static void doWork(java.sql.Connection conn) throws Exception {
    System.out.println("Hello OCJDBC!");

    for (int i = 0; i < 200; i++) {
      Scope ss = tracer.spanBuilder(String.format("DoWork-%d", i)).startScopedSpan();
      try {
        java.sql.Statement stmt = conn.createStatement();
        java.sql.ResultSet rs = stmt.executeQuery("SELECT * from repro");
        rs.close();
        System.out.println("Iteration #" + i);
      } finally {
        ss.close();
      }

      Thread.sleep(4000);
    }
  }

  public static void enableObservability() throws Exception {
    // Enable metrics with OpenCensus.
    Observability.registerAllViews();

    TraceConfig traceConfig = Tracing.getTraceConfig();
    // For demo purposes, lets always sample.
    traceConfig.updateActiveTraceParams(
        traceConfig.getActiveTraceParams().toBuilder().setSampler(Samplers.alwaysSample()).build());

    // The trace exporter.
    JaegerTraceExporter.createAndRegister("http://127.0.0.1:14268/api/traces", "ocjdbc-demo");

    // The metrics exporter.
    PrometheusStatsCollector.createAndRegister();

    // Run the server as a daeon on address "localhost:8889".
    HTTPServer server = new HTTPServer("localhost", 8889);
  }
}
<project xmlns="http://maven.apache.org/POM/4.0.0" xmlns:xsi="http://www.w3.org/2001/XMLSchema-instance" xsi:schemaLocation="http://maven.apache.org/POM/4.0.0 http://maven.apache.org/maven-v4_0_0.xsd">
<modelVersion>4.0.0</modelVersion>
<groupId>io.opencensus</groupId>
<artifactId>ocjdbc-app</artifactId>
<packaging>jar</packaging>
<version>0.0.1</version>
<name>ocjdbc-app</name>
<url>http://maven.apache.org</url>
<properties>
<project.build.sourceEncoding>UTF-8</project.build.sourceEncoding>
<opencensus.version>0.24.0</opencensus.version>
</properties>
<dependencies>
<dependency>
<groupId>io.opencensus</groupId>
<artifactId>opencensus-api</artifactId>
<version>${opencensus.version}</version>
</dependency>
<dependency>
<groupId>io.opencensus</groupId>
<artifactId>opencensus-impl</artifactId>
<version>${opencensus.version}</version>
</dependency>
<dependency>
<groupId>io.orijtech.integrations</groupId>
<artifactId>ocjdbc</artifactId>
<version>0.0.6</version>
</dependency>
<dependency>
<groupId>mysql</groupId>
<artifactId>mysql-connector-java</artifactId>
<version>8.0.12</version>
</dependency>
<dependency>
<groupId>io.opencensus</groupId>
<artifactId>opencensus-exporter-stats-prometheus</artifactId>
<version>${opencensus.version}</version>
</dependency>
<dependency>
<groupId>io.prometheus</groupId>
<artifactId>simpleclient_httpserver</artifactId>
<version>0.4.0</version>
</dependency>
<dependency>
<groupId>io.opencensus</groupId>
<artifactId>opencensus-exporter-trace-jaeger</artifactId>
<version>${opencensus.version}</version>
</dependency>
</dependencies>
<build>
<extensions>
<extension>
<groupId>kr.motd.maven</groupId>
<artifactId>os-maven-plugin</artifactId>
<version>1.5.0.Final</version>
</extension>
</extensions>
<pluginManagement>
<plugins>
<plugin>
<groupId>org.apache.maven.plugins</groupId>
<artifactId>maven-compiler-plugin</artifactId>
<version>3.7.0</version>
<configuration>
<source>1.8</source>
<target>1.8</target>
</configuration>
</plugin>
</plugins>
</pluginManagement>
<plugins>
<plugin>
<groupId>org.codehaus.mojo</groupId>
<artifactId>appassembler-maven-plugin</artifactId>
<version>1.10</version>
<configuration>
<programs>
<program>
<id>SQLApp</id>
<mainClass>io.opencensus.tutorials.ocjdbc.App</mainClass>
</program>
</programs>
</configuration>
</plugin>
</plugins>
</build>
</project>but also the Prometheus config.yaml file saved in config.yaml
scrape_configs:
  - job_name: 'ocjavametricstutorial'

    scrape_interval: 10s

    static_configs:
      - targets: ['localhost:8889']
Running it
With the Java source code properly placed in src/main/java/io/opencensus/tutorial/ocjdbc/App.java and the pom.xml file,
we can now do
mvn install && mvn exec:java -Dexec.mainClass=io.opencensus.tutorial.ocjdbc.Appand then start up Jaeger and Prometheus as per
| Starter | URL |
|---|---|
| Jaeger | https://opencensus.io/codelabs/jaeger |
| Prometheus | https://opencensus.io/codelabs/prometheus |
in another terminal, please run Prometheus as per
prometheus --config.file=config.yamlwhich should then produce such output
Hello OCJDBC!
Iteration #0
Iteration #1
Iteration #2
Iteration #3
Iteration #4
Iteration #5
Iteration #6
Iteration #7
Iteration #8
Iteration #9
Iteration #10
Iteration #11
Iteration #12
Iteration #13
Iteration #14
Iteration #15
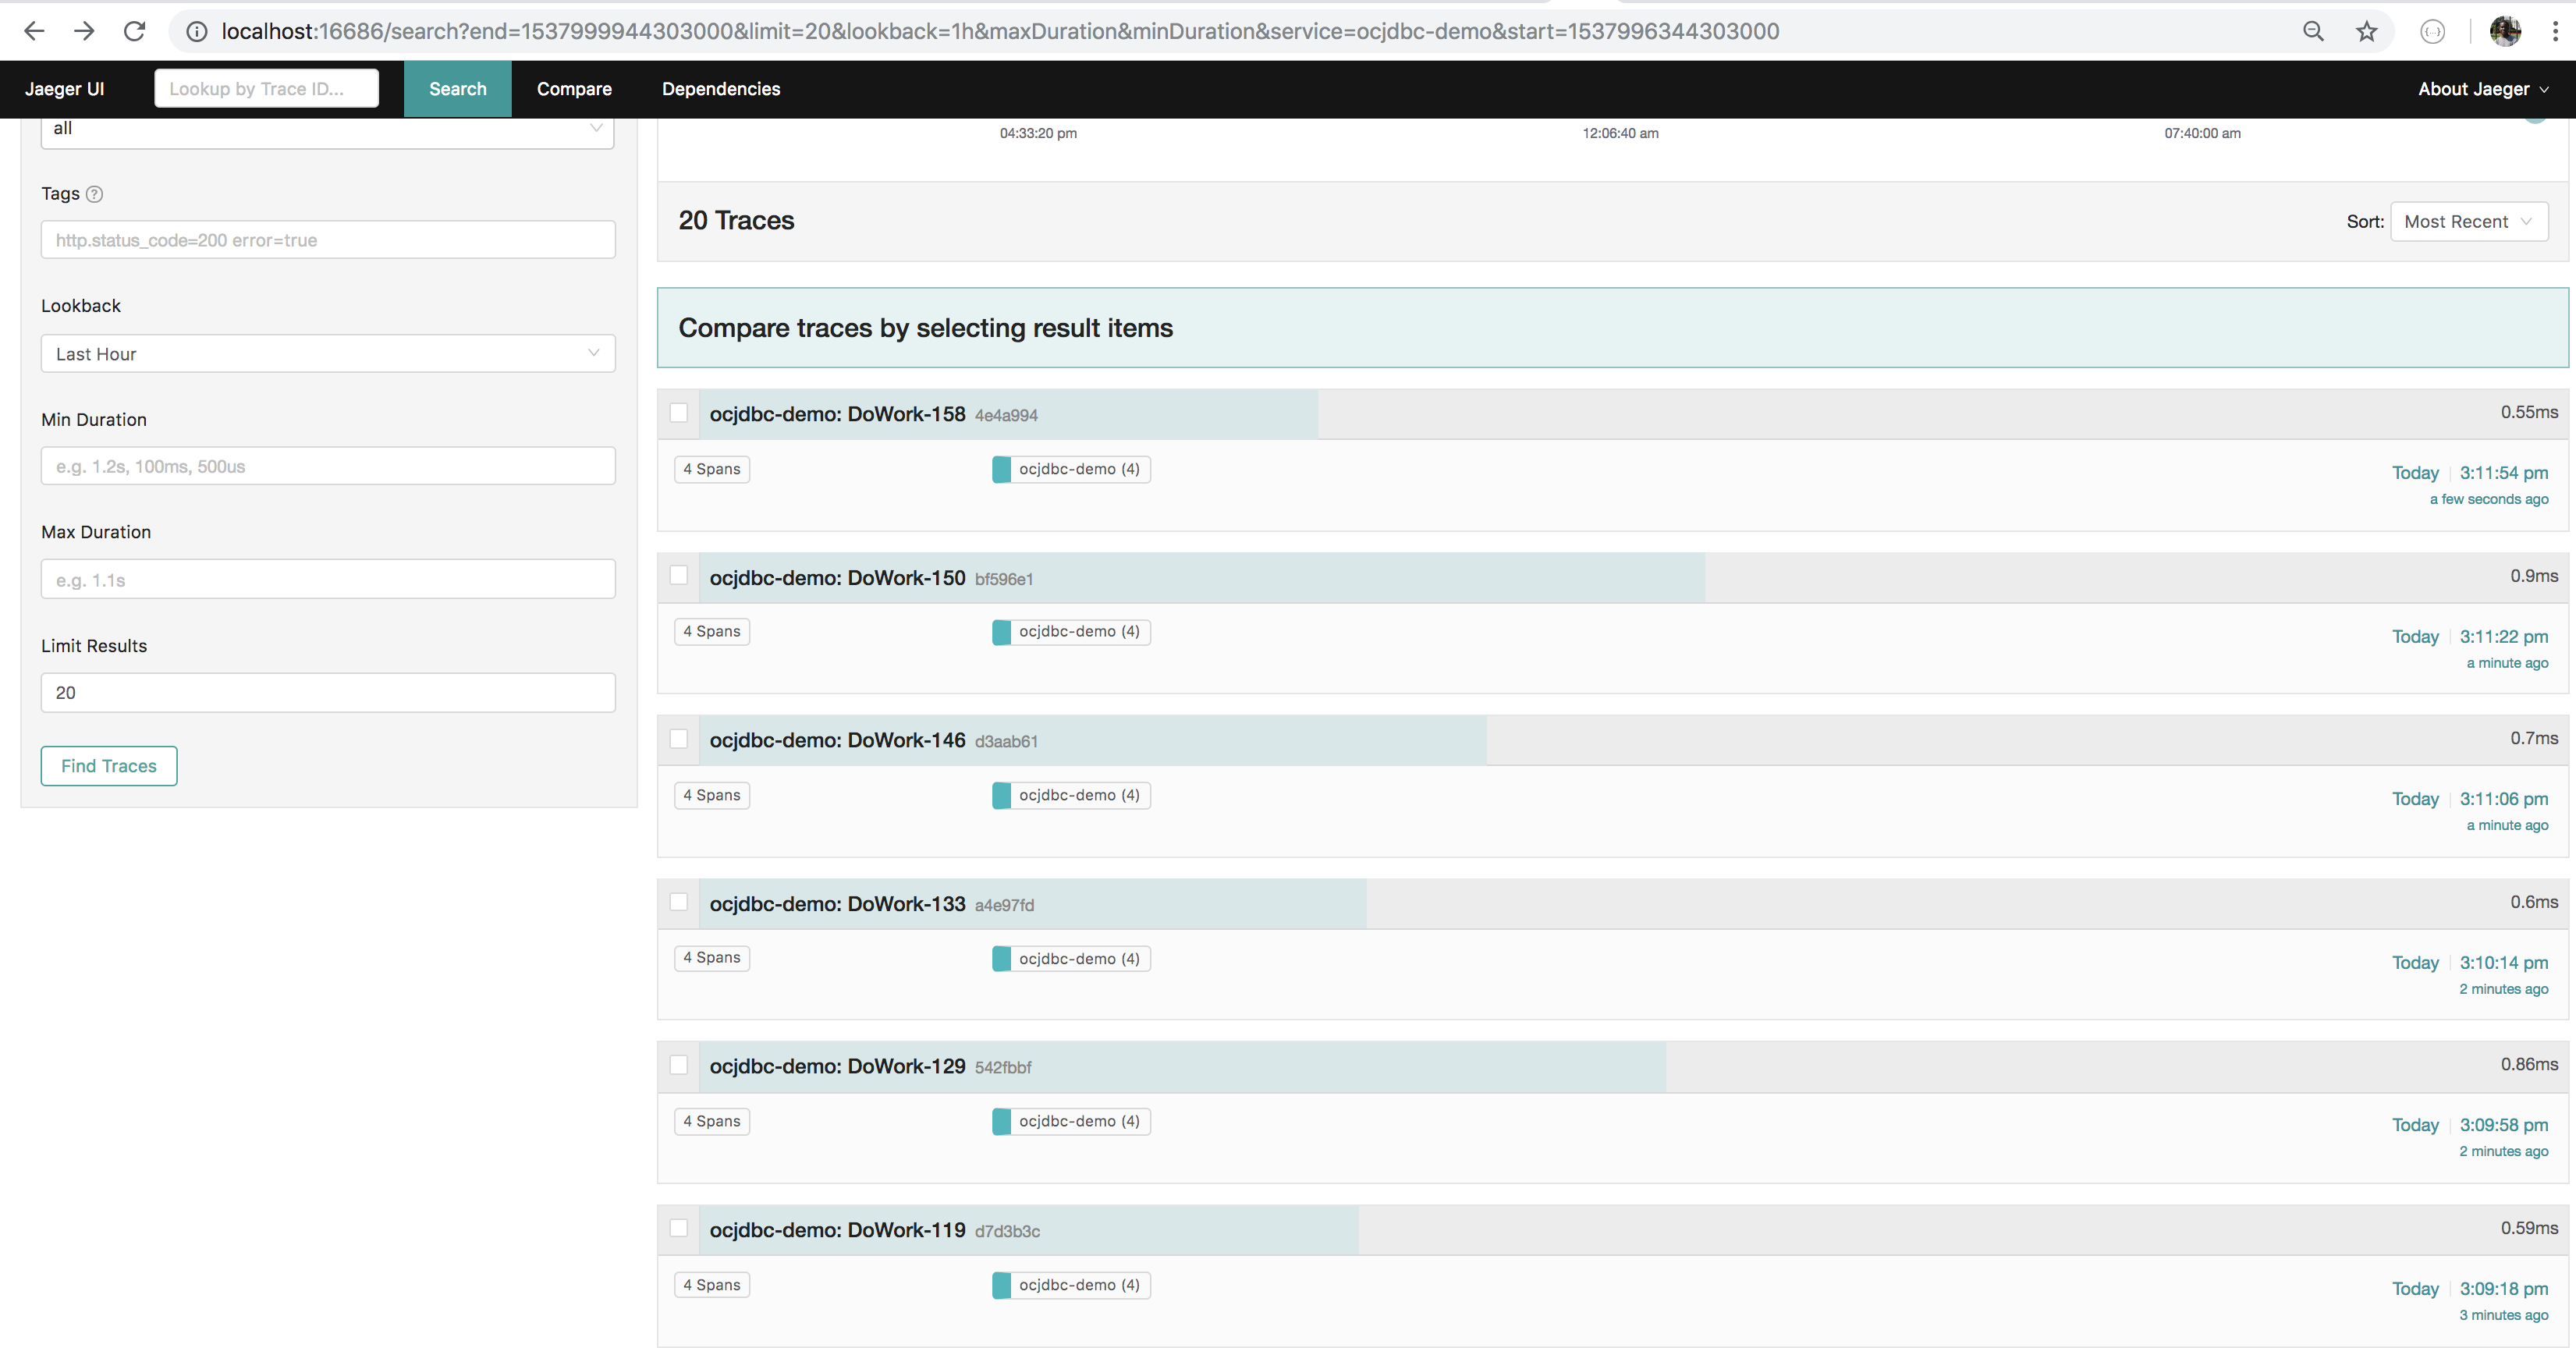
Iteration #16Examining the traces
With Jaeger running, we can navigate to the Jaeger UI at http://localhost:16686/search you should be able to see such visuals
All traces
An individual trace with option
Observability.ANNOTATE_TRACES_WITH_SQLdisabled// Then create/wrap it with the instrumented Connection from "io.opencensus.ocjdbc". java.sql.Connection conn = new OcWrapConnection(originalConn, EnumSet.of(Observability.TraceOption.NONE));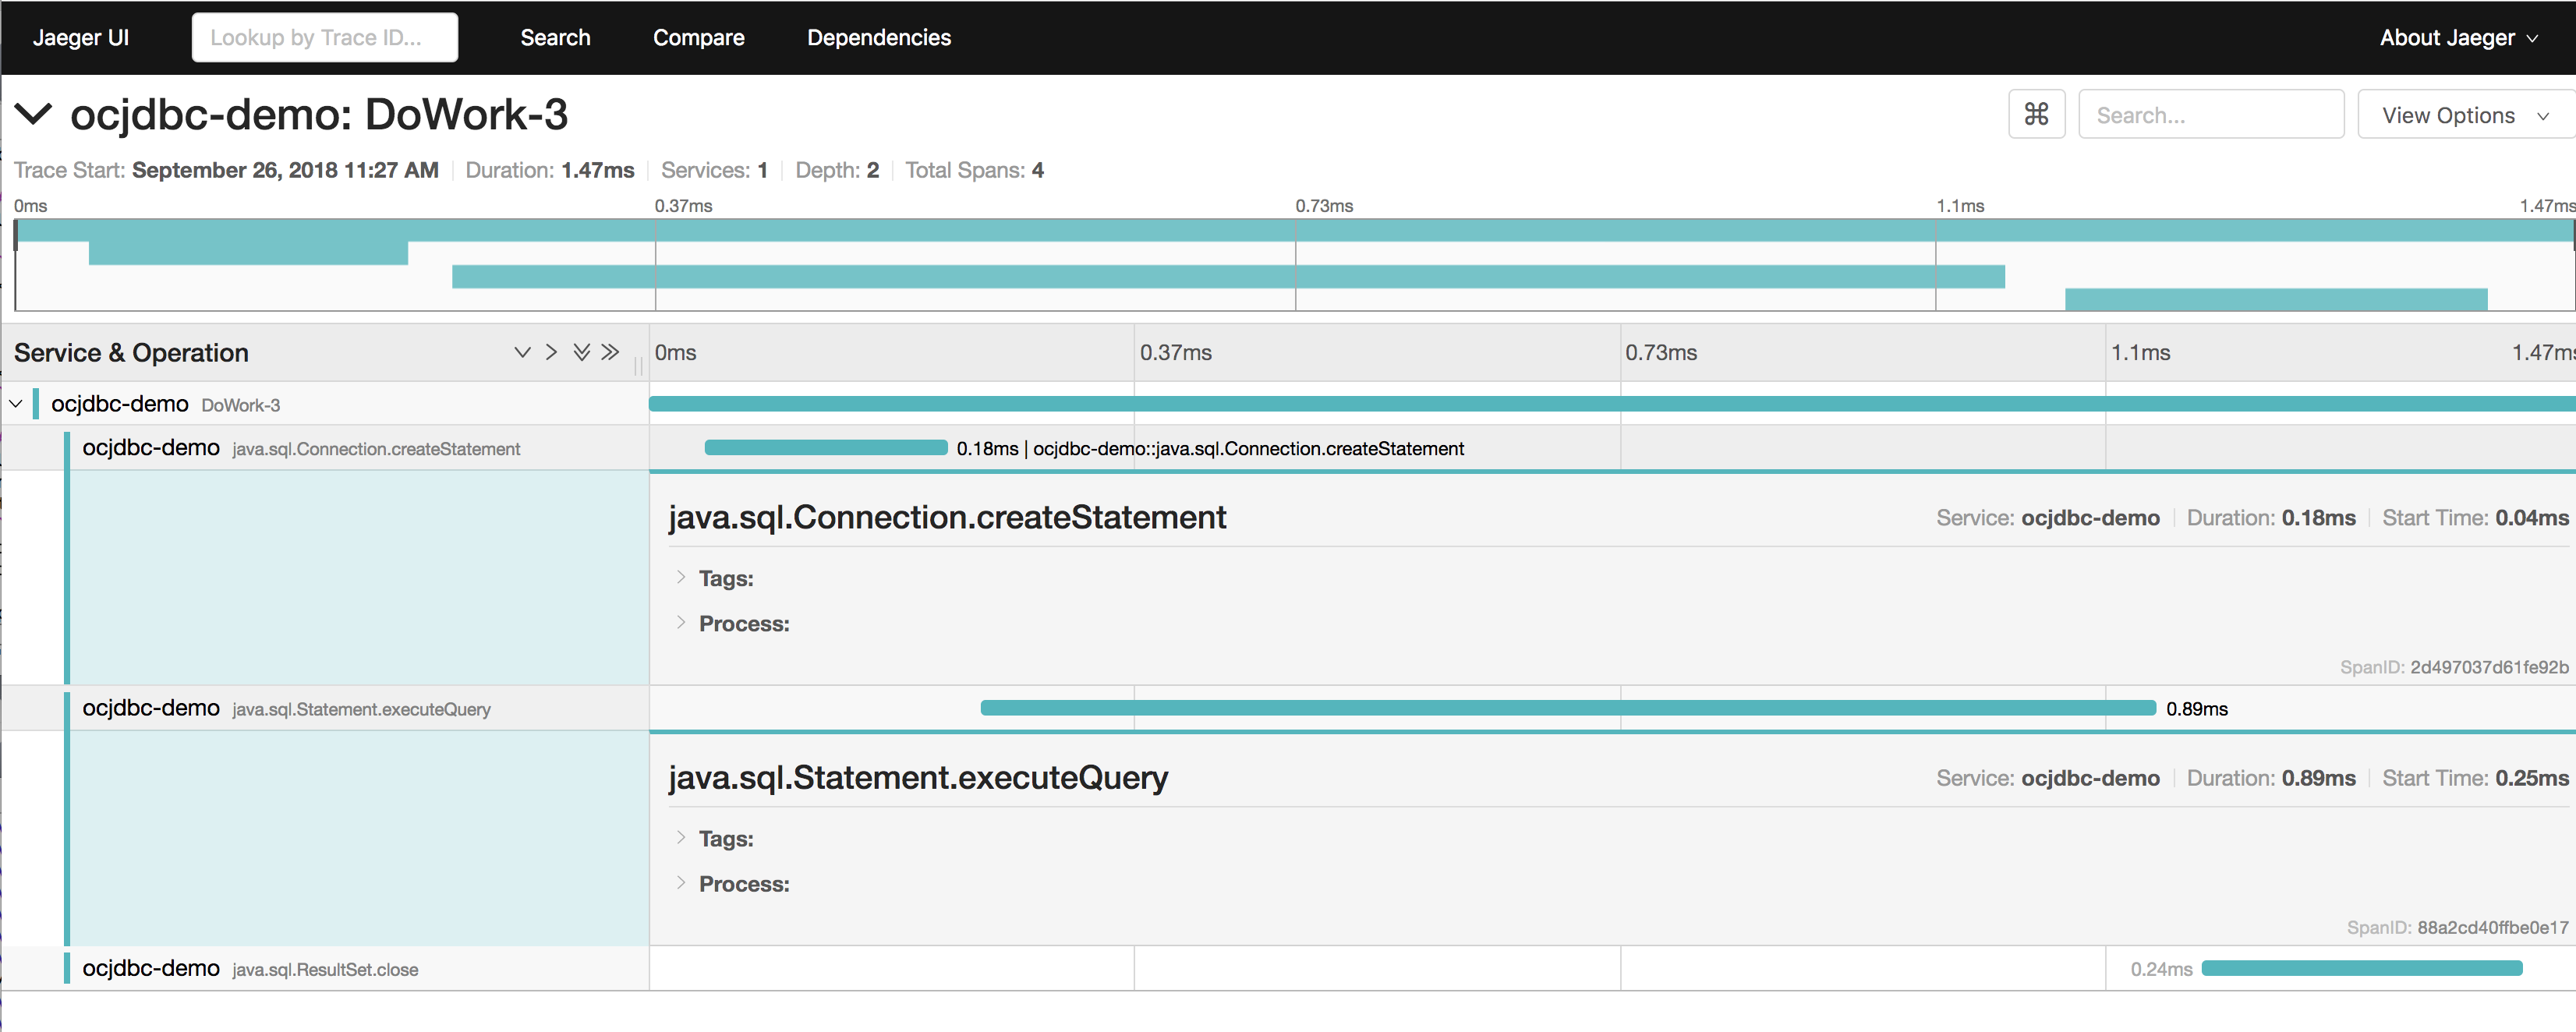
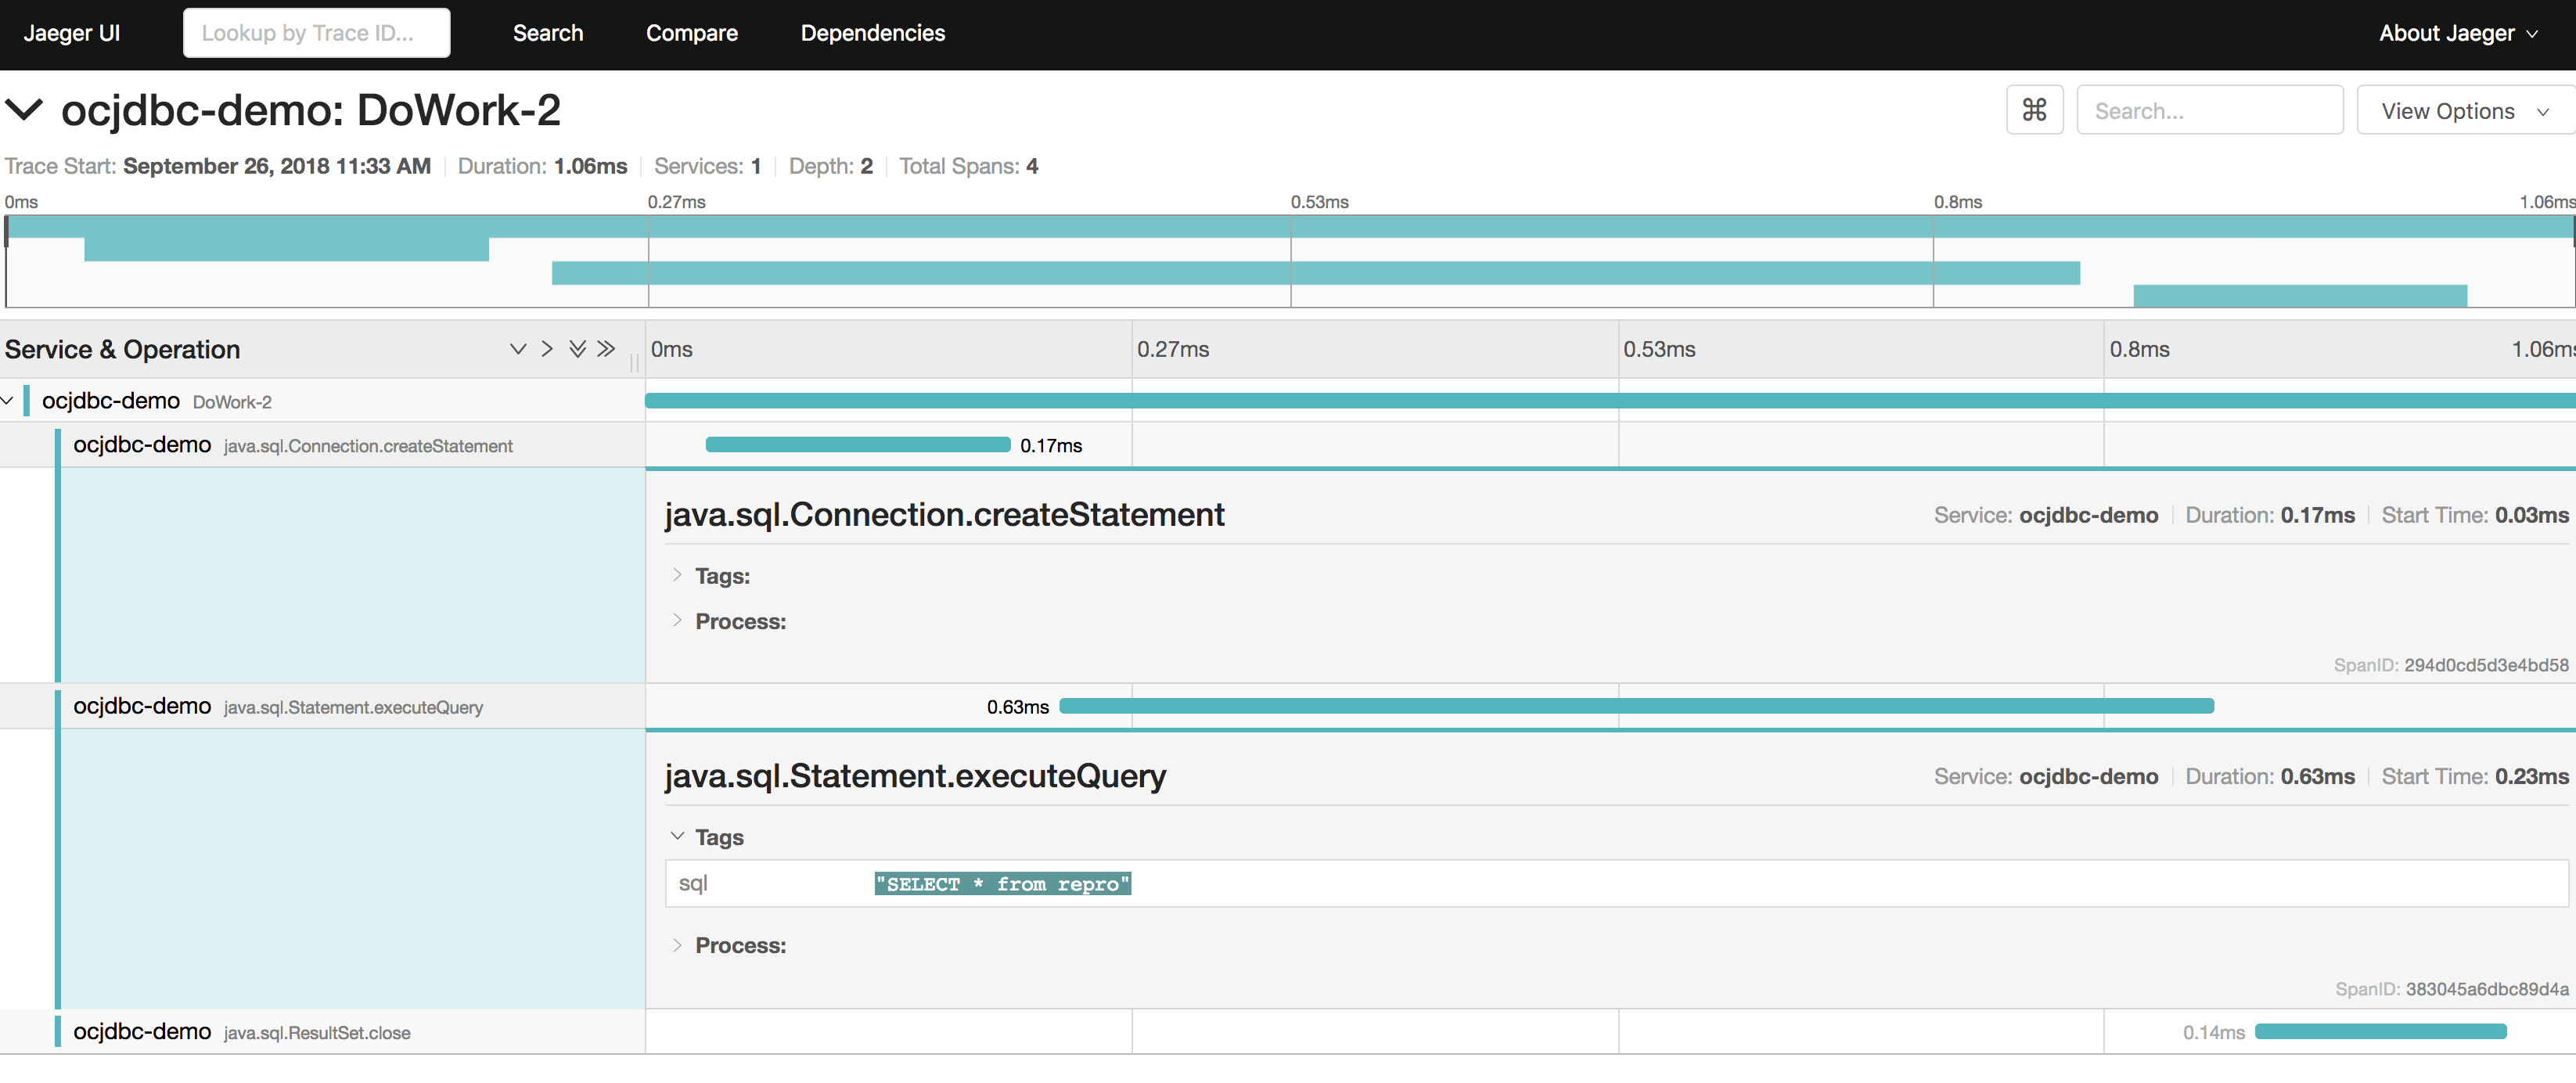
An individual trace with
Observability.TraceOption.ANNOTATE_TRACES_WITH_SQLenabled
    java.sql.Connection conn = new Connection(originalConn,
                                        // And passing this option to allow the spans
                                        // to be annotated with the SQL queries.
                                        // Please note that this could be a security concern
                                        // since it could reveal personally identifying information.
                                        EnumSet.of(Observability.ANNOTATE_TRACES_WITH_SQL));
giving
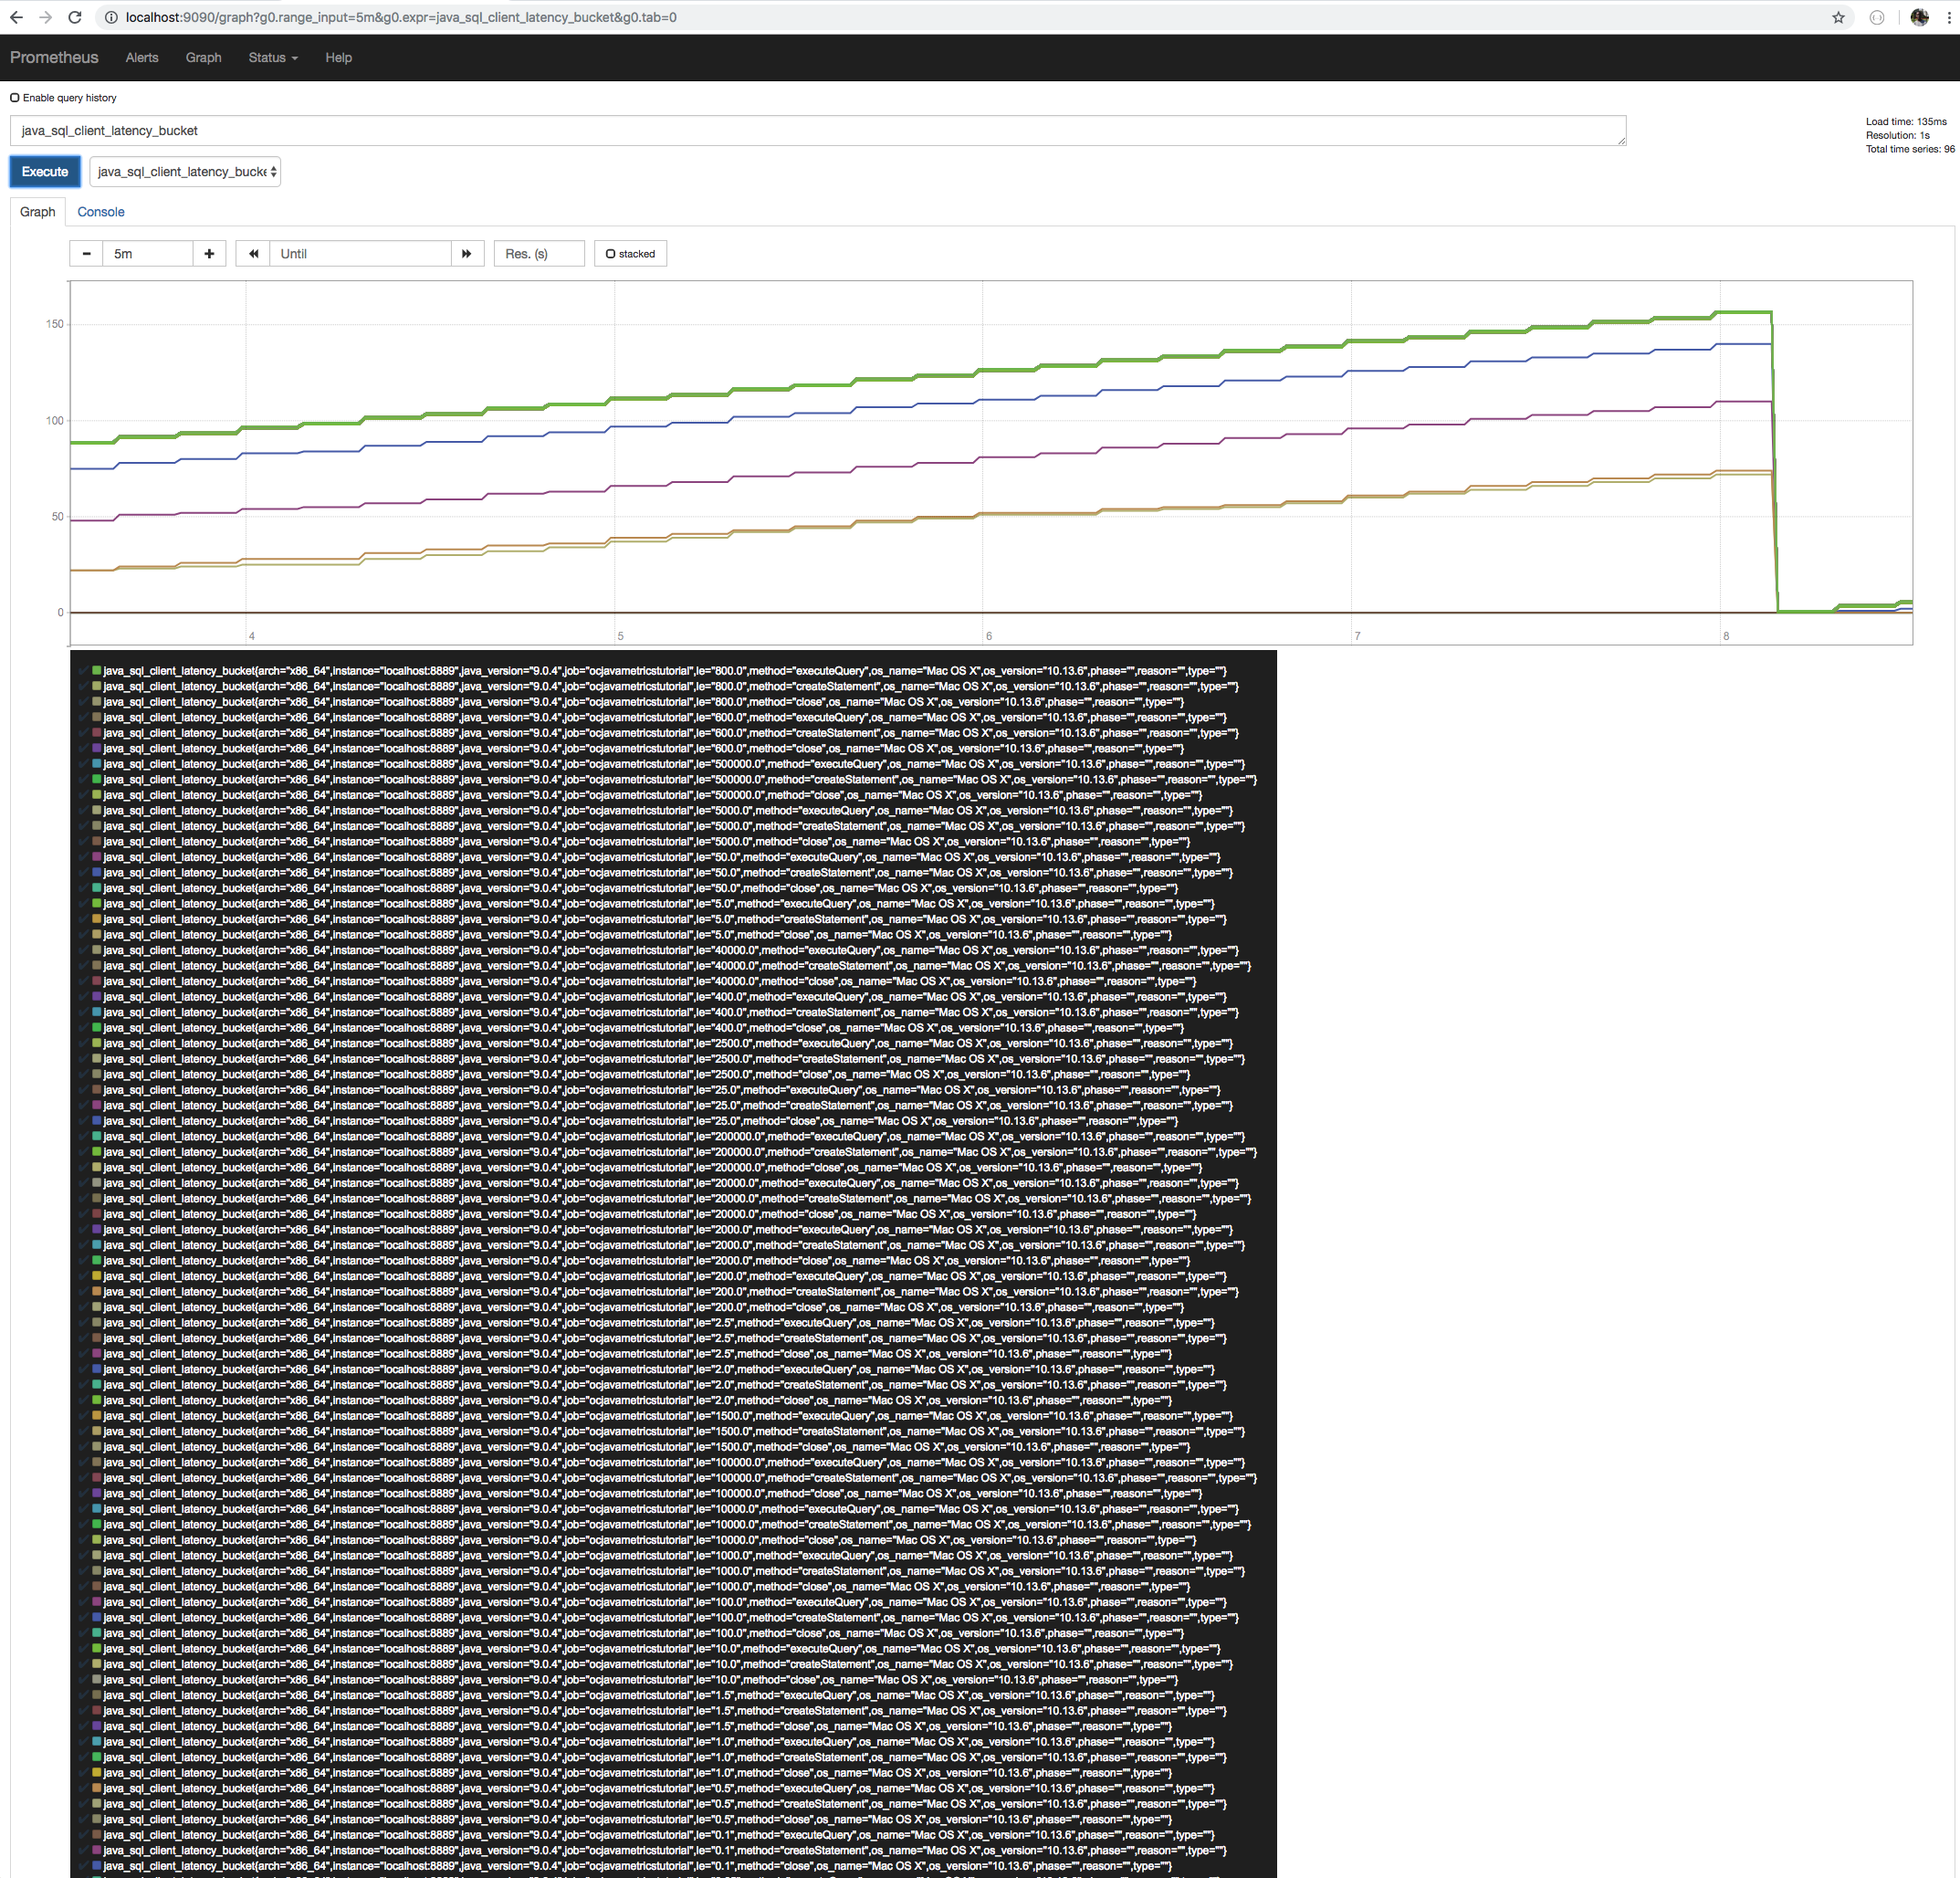
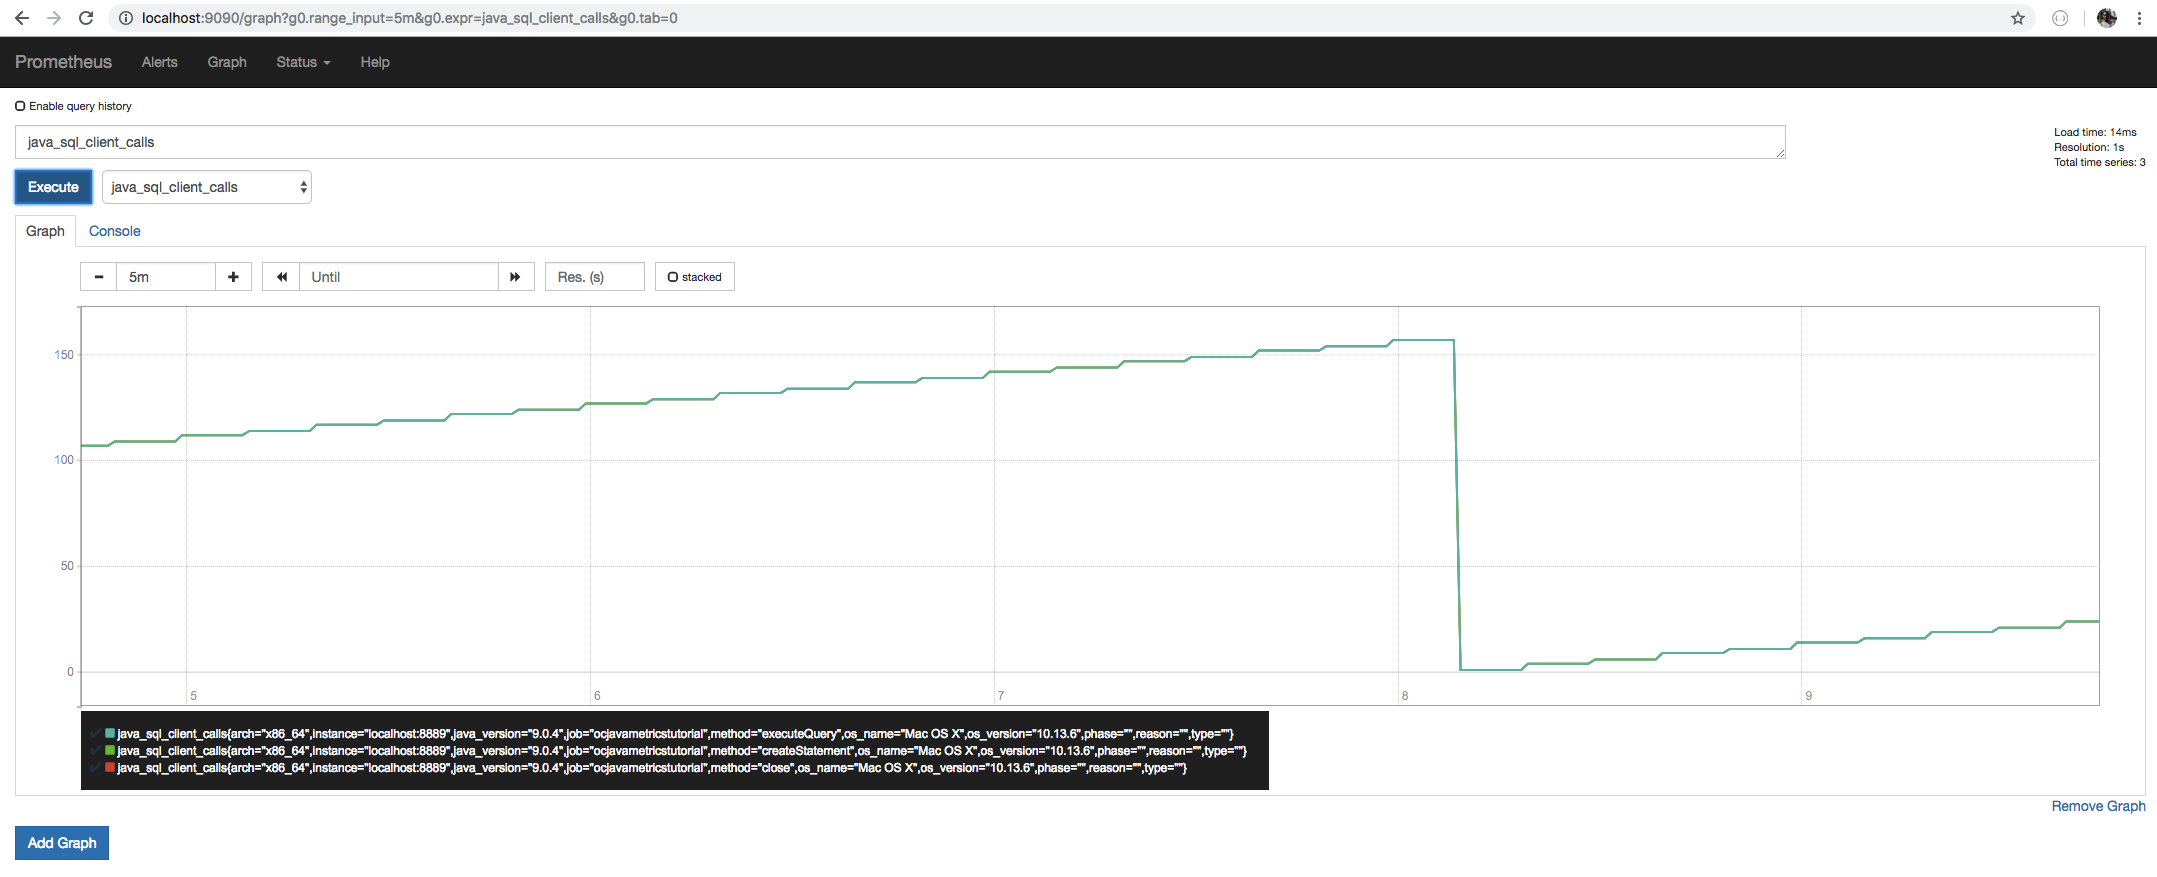
Examining the metrics
With Prometheus running, we can navigate to the Prometheus UI at http://localhost:9090/graph you should be able to see such visuals
All metrics
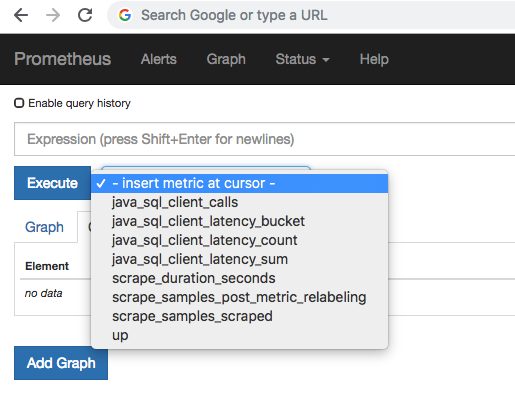
Latency buckets
Calls
References
| Resource | URL |
|---|---|
| JDBC information page | https://docs.oracle.com/javase/8/docs/technotes/guides/jdbc/ |
| OCJDBC Github repository | https://github.com/opencensus-integrations/ocjdbc |
| JDBC JavaDoc | https://docs.oracle.com/javase/8/docs/api/index.html?java/sql/package-summary.html |