Metrics
- Requirements
- Installation
- Brief Overview
- Getting started
- Create and Record Metrics
- Enable Views
- Exporting to Prometheus
In this quickstart, we’ll glean insights from code segments and learn how to:
- Collect metrics using OpenCensus Metrics and Tags
- Register and enable an exporter for a backend of our choice
- View the metrics on the backend of our choice
Requirements
- Python2 and above
- Prometheus as our choice of metrics backend: we are picking it because it is free, open source and easy to setup
For assistance setting up Prometheus, Click here for a guided codelab.
You can swap out any other exporter from the list of Python exporters
Installation
pip install --upgrade opencensus opencensus-ext-prometheus prometheus-client
Brief Overview
By the end of this tutorial, we will do these four things to obtain metrics using OpenCensus:
- Create quantifiable metrics (numerical) that we will record
- Create tags that we will associate with our metrics
- Organize our metrics, similar to writing a report, in to a
View - Export our views to a backend (Prometheus in this case)
Getting Started
Unsure how to write and execute Python code? Click here.
We will be a simple “read-evaluate-print” (REPL) app. In there we’ll collect some metrics to observe the work that is going on within this code, such as:
- Latency per processing loop
- Number of lines read
- Number of errors
- Line lengths
First, create a file called repl.py.
touch repl.pyNext, put the following code inside of repl.py:
#!/usr/bin/env python

import sys

def main():
    # In a REPL:
    #1. Read input
    #2. process input
    while True:
        line = sys.stdin.readline()
        print(line.upper())

if __name__ == '__main__':
      main()
You can run the code via python repl.py.
Create and record Metrics
Now we’ll import the required packages and instrument our code.
from opencensus.stats import aggregation as aggregation_module
from opencensus.stats import measure as measure_module
from opencensus.stats import stats as stats_module
from opencensus.stats import view as view_module
from opencensus.tags import tag_key as tag_key_module
from opencensus.tags import tag_map as tag_map_module
from opencensus.tags import tag_value as tag_value_module

# Create the measures
# The latency in milliseconds
m_latency_ms = measure_module.MeasureFloat("repl_latency", "The latency in milliseconds per REPL loop", "ms")

# Counts/groups the lengths of lines read in.
m_line_lengths = measure_module.MeasureInt("repl_line_lengths", "The distribution of line lengths", "By")
#!/usr/bin/env python
import sys
import time
from opencensus.stats import aggregation as aggregation_module
from opencensus.stats import measure as measure_module
from opencensus.stats import stats as stats_module
from opencensus.tags import tag_key as tag_key_module
from opencensus.tags import tag_map as tag_map_module
from opencensus.tags import tag_value as tag_value_module
# Create the measures
# The latency in milliseconds
m_latency_ms = measure_module.MeasureFloat("repl/latency", "The latency in milliseconds per REPL loop", "ms")
# Counts/groups the lengths of lines read in.
m_line_lengths = measure_module.MeasureInt("repl_line_lengths", "The distribution of line lengths", "By")
# The stats recorder
stats_recorder = stats_module.stats.stats_recorder
# Create the tag key
key_method = tag_key_module.TagKey("method")
# Create the status key
key_status = tag_key_module.TagKey("status")
# Create the error key
key_error = tag_key_module.TagKey("error")
def main():
# In a REPL:
# 1. Read input
# 2. process input
while True:
readEvaluateProcessLine()
def readEvaluateProcessLine():
line = sys.stdin.readline()
start = time.time()
print(line.upper())
# Now record the stats
# Create the measure_map into which we'll insert the measurements
mmap = stats_recorder.new_measurement_map()
end_ms = (time.time() - start) * 1000.0 # Seconds to milliseconds
# Record the latency
mmap.measure_float_put(m_latency_ms, end_ms)
# Record the line length
mmap.measure_int_put(m_line_lengths, len(line))
tmap = tag_map_module.TagMap()
tmap.insert(key_method, tag_value_module.TagValue("repl"))
tmap.insert(key_status, tag_value_module.TagValue("OK"))
# Insert the tag map finally
mmap.record(tmap)
if __name__ == "__main__":
main()With views and all enabled
In order to analyze these stats, we’ll need to aggregate our data with Views.
#!/usr/bin/env python

import sys
import time

from opencensus.stats import aggregation as aggregation_module
from opencensus.stats import measure as measure_module
from opencensus.stats import stats as stats_module
from opencensus.stats import view as view_module
from opencensus.tags import tag_key as tag_key_module
from opencensus.tags import tag_map as tag_map_module
from opencensus.tags import tag_value as tag_value_module

# Create the measures
# The latency in milliseconds
m_latency_ms = measure_module.MeasureFloat("repl_latency", "The latency in milliseconds per REPL loop", "ms")

# Counts/groups the lengths of lines read in.
m_line_lengths = measure_module.MeasureInt("repl_line_lengths", "The distribution of line lengths", "By")

# The stats recorder
stats_recorder = stats_module.stats.stats_recorder

# Create the tag key
key_method = tag_key_module.TagKey("method")
# Create the status key
key_status = tag_key_module.TagKey("status")
# Create the error key
key_error = tag_key_module.TagKey("error")

latency_view = view_module.View("demo_latency", "The distribution of the latencies",
    [key_method, key_status, key_error],
    m_latency_ms,
    # Latency in buckets:
    # [>=0ms, >=25ms, >=50ms, >=75ms, >=100ms, >=200ms, >=400ms, >=600ms, >=800ms, >=1s, >=2s, >=4s, >=6s]
    aggregation_module.DistributionAggregation([0, 25, 50, 75, 100, 200, 400, 600, 800, 1000, 2000, 4000, 6000]))

line_count_view = view_module.View("demo_lines_in", "The number of lines from standard input",
    [key_method, key_status, key_error],
    m_line_lengths,
    aggregation_module.CountAggregation())

line_length_view = view_module.View("demo_line_lengths", "Groups the lengths of keys in buckets",
    [key_method, key_status, key_error],
    m_line_lengths,
    # Lengths: [>=0B, >=5B, >=10B, >=15B, >=20B, >=40B, >=60B, >=80, >=100B, >=200B, >=400, >=600, >=800, >=1000]
    aggregation_module.DistributionAggregation([0, 5, 10, 15, 20, 40, 60, 80, 100, 200, 400, 600, 800, 1000]))

def main():
    # In a REPL:
    # 1. Read input
    # 2. process input
    while True:
        readEvaluateProcessLine()

def readEvaluateProcessLine():
    line = sys.stdin.readline()
    start = time.time()
    print(line.upper())

    # Now record the stats
    # Create the measure_map into which we'll insert the measurements
    mmap = stats_recorder.new_measurement_map()
    end_ms = (time.time() - start) * 1000.0 # Seconds to milliseconds

    # Record the latency
    mmap.measure_float_put(m_latency_ms, end_ms)

    # Record the line length
    mmap.measure_int_put(m_line_lengths, len(line))

    tmap = tag_map_module.TagMap()
    tmap.insert(key_method, tag_value_module.TagValue("repl"))
    tmap.insert(key_status, tag_value_module.TagValue("OK"))

    # Insert the tag map finally
    mmap.record(tmap)

if __name__ == "__main__":
    main()
Register Views
We will create a function called setupOpenCensusAndPrometheusExporter and call it from our main function:
def main():
    setupOpenCensusAndPrometheusExporter()

    while True:
        readEvaluateProcessLine()

def registerAllViews(view_manager):
    view_manager.register_view(latency_view)
    view_manager.register_view(line_count_view)
    view_manager.register_view(line_length_view)

def setupOpenCensusAndPrometheusExporter():
    stats = stats_module.stats
    view_manager = stats.view_manager
    registerAllViews(view_manager)
#!/usr/bin/env python
import sys
import time
from opencensus.ext.prometheus import stats_exporter as prometheus
from opencensus.stats import aggregation as aggregation_module
from opencensus.stats import measure as measure_module
from opencensus.stats import stats as stats_module
from opencensus.stats import view as view_module
from opencensus.tags import tag_key as tag_key_module
from opencensus.tags import tag_map as tag_map_module
from opencensus.tags import tag_value as tag_value_module
# Create the measures
# The latency in milliseconds
m_latency_ms = measure_module.MeasureFloat("repl_latency", "The latency in milliseconds per REPL loop", "ms")
# Counts/groups the lengths of lines read in.
m_line_lengths = measure_module.MeasureInt("repl_line_lengths", "The distribution of line lengths", "By")
# The stats recorder
stats_recorder = stats_module.stats.stats_recorder
# Create the tag key
key_method = tag_key_module.TagKey("method")
# Create the status key
key_status = tag_key_module.TagKey("status")
# Create the error key
key_error = tag_key_module.TagKey("error")
latency_view = view_module.View("demo_latency", "The distribution of the latencies",
[key_method, key_status, key_error],
m_latency_ms,
# Latency in buckets:
# [>=0ms, >=25ms, >=50ms, >=75ms, >=100ms, >=200ms, >=400ms, >=600ms, >=800ms, >=1s, >=2s, >=4s, >=6s]
aggregation_module.DistributionAggregation([0, 25, 50, 75, 100, 200, 400, 600, 800, 1000, 2000, 4000, 6000]))
line_count_view = view_module.View("demo_lines_in", "The number of lines from standard input",
[key_method, key_status, key_error],
m_line_lengths,
aggregation_module.CountAggregation())
line_length_view = view_module.View("demo_line_lengths", "Groups the lengths of keys in buckets",
[key_method, key_status, key_error],
m_line_lengths,
# Lengths: [>=0B, >=5B, >=10B, >=15B, >=20B, >=40B, >=60B, >=80, >=100B, >=200B, >=400, >=600, >=800, >=1000]
aggregation_module.DistributionAggregation([0, 5, 10, 15, 20, 40, 60, 80, 100, 200, 400, 600, 800, 1000]))
def main():
# In a REPL:
# 1. Read input
# 2. process input
setupOpenCensusAndPrometheusExporter()
while True:
readEvaluateProcessLine()
def registerAllViews(view_manager):
view_manager.register_view(latency_view)
view_manager.register_view(line_count_view)
view_manager.register_view(line_length_view)
def setupOpenCensusAndPrometheusExporter():
stats = stats_module.stats
view_manager = stats.view_manager
registerAllViews(view_manager)
def readEvaluateProcessLine():
line = sys.stdin.readline()
start = time.time()
print(line.upper())
# Now record the stats
# Create the measure_map into which we'll insert the measurements
mmap = stats_recorder.new_measurement_map()
end_ms = (time.time() - start) * 1000.0 # Seconds to milliseconds
# Record the latency
mmap.measure_float_put(m_latency_ms, end_ms)
# Record the line length
mmap.measure_int_put(m_line_lengths, len(line))
tmap = tag_map_module.TagMap()
tmap.insert(key_method, tag_value_module.TagValue("repl"))
tmap.insert(key_status, tag_value_module.TagValue("OK"))
# Insert the tag map finally
mmap.record(tmap)
if __name__ == "__main__":
main()Exporting to Prometheus
We need to expose the Prometheus endpoint say on address “localhost:8000” in order for Prometheus to scrape our application by expanding setupOpenCensusAndPrometheusExporter , like so:
def setupOpenCensusAndPrometheusExporter():
    stats = stats_module.stats
    view_manager = stats.view_manager

    exporter = prometheus.new_stats_exporter(prometheus.Options(namespace="oc_python", port=8000))

    view_manager.register_exporter(exporter)
    registerAllViews(view_manager)
Here is the final state of the code:
#!/usr/bin/env python

import sys
import time

from opencensus.ext.prometheus import stats_exporter as prometheus

from opencensus.stats import aggregation as aggregation_module
from opencensus.stats import measure as measure_module
from opencensus.stats import stats as stats_module
from opencensus.stats import view as view_module
from opencensus.tags import tag_key as tag_key_module
from opencensus.tags import tag_map as tag_map_module
from opencensus.tags import tag_value as tag_value_module

# Create the measures
# The latency in milliseconds
m_latency_ms = measure_module.MeasureFloat("repl_latency", "The latency in milliseconds per REPL loop", "ms")

# Counts/groups the lengths of lines read in.
m_line_lengths = measure_module.MeasureInt("repl_line_lengths", "The distribution of line lengths", "By")

# The stats recorder
stats_recorder = stats_module.stats.stats_recorder

# Create the tag key
key_method = tag_key_module.TagKey("method")
# Create the status key
key_status = tag_key_module.TagKey("status")
# Create the error key
key_error = tag_key_module.TagKey("error")

latency_view = view_module.View("demo_latency", "The distribution of the latencies",
    [key_method, key_status, key_error],
    m_latency_ms,
    # Latency in buckets:
    # [>=0ms, >=25ms, >=50ms, >=75ms, >=100ms, >=200ms, >=400ms, >=600ms, >=800ms, >=1s, >=2s, >=4s, >=6s]
    aggregation_module.DistributionAggregation([0, 25, 50, 75, 100, 200, 400, 600, 800, 1000, 2000, 4000, 6000]))

line_count_view = view_module.View("demo_lines_in", "The number of lines from standard input",
    [key_method, key_status, key_error],
    m_line_lengths,
    aggregation_module.CountAggregation())

line_length_view = view_module.View("demo_line_lengths", "Groups the lengths of keys in buckets",
    [key_method, key_status, key_error],
    m_line_lengths,
    # Lengths: [>=0B, >=5B, >=10B, >=15B, >=20B, >=40B, >=60B, >=80, >=100B, >=200B, >=400, >=600, >=800, >=1000]
    aggregation_module.DistributionAggregation([0, 5, 10, 15, 20, 40, 60, 80, 100, 200, 400, 600, 800, 1000]))

def main():
    # In a REPL:
    # 1. Read input
    # 2. process input
    setupOpenCensusAndPrometheusExporter()

    while True:
        readEvaluateProcessLine()


def registerAllViews(view_manager):
    view_manager.register_view(latency_view)
    view_manager.register_view(line_count_view)
    view_manager.register_view(line_length_view)


def setupOpenCensusAndPrometheusExporter():
    stats = stats_module.stats
    view_manager = stats.view_manager

    exporter = prometheus.new_stats_exporter(prometheus.Options(namespace="oc_python", port=8000))

    view_manager.register_exporter(exporter)
    registerAllViews(view_manager)


def readEvaluateProcessLine():
    line = sys.stdin.readline()
    start = time.time()
    print(line.upper())

    # Now record the stats
    # Create the measure_map into which we'll insert the measurements
    mmap = stats_recorder.new_measurement_map()
    end_ms = (time.time() - start) * 1000.0 # Seconds to milliseconds

    # Record the latency
    mmap.measure_float_put(m_latency_ms, end_ms)

    # Record the line length
    mmap.measure_int_put(m_line_lengths, len(line))

    tmap = tag_map_module.TagMap()
    tmap.insert(key_method, tag_value_module.TagValue("repl"))
    tmap.insert(key_status, tag_value_module.TagValue("OK"))

    # Insert the tag map finally
    mmap.record(tmap)

if __name__ == "__main__":
    main()
Prometheus configuration file
To allow Prometheus to scrape from our application, we have to point it towards the tutorial application whose server is running on “localhost:8000”.
To do this, we firstly need to create a YAML file with the configuration e.g. promconfig.yaml
whose contents are:
scrape_configs:
- job_name: 'ocpythonmetrics_tutorial'

scrape_interval: 10s

static_configs:
- targets: ['localhost:8000']
Running Prometheus
With that file saved as promconfig.yaml we should now be able to run Prometheus like this
prometheus --config.file=promconfig.yamland then return to the terminal that’s running the Python metrics quickstart and generate some work by typing inside it.
Viewing your metrics
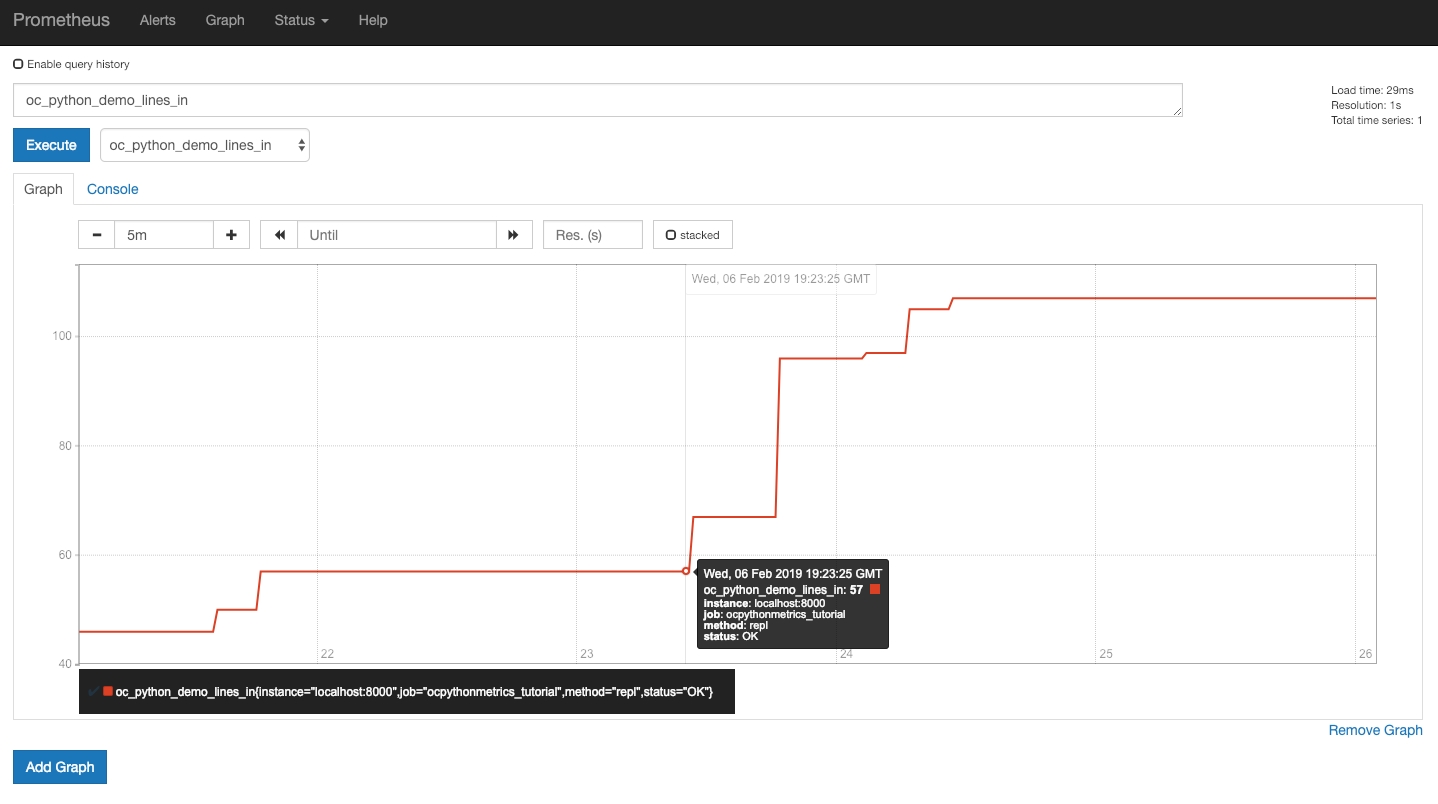
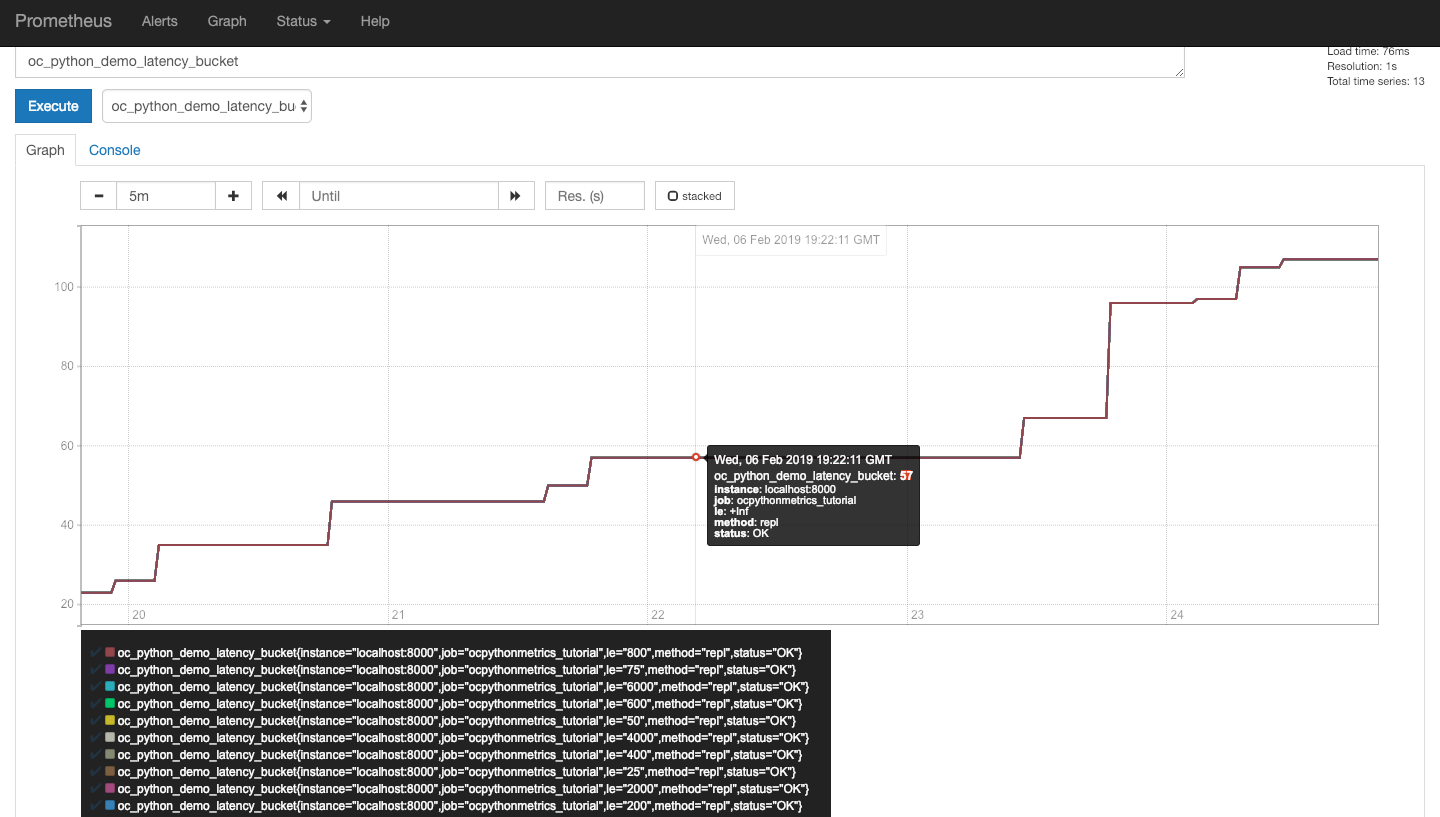
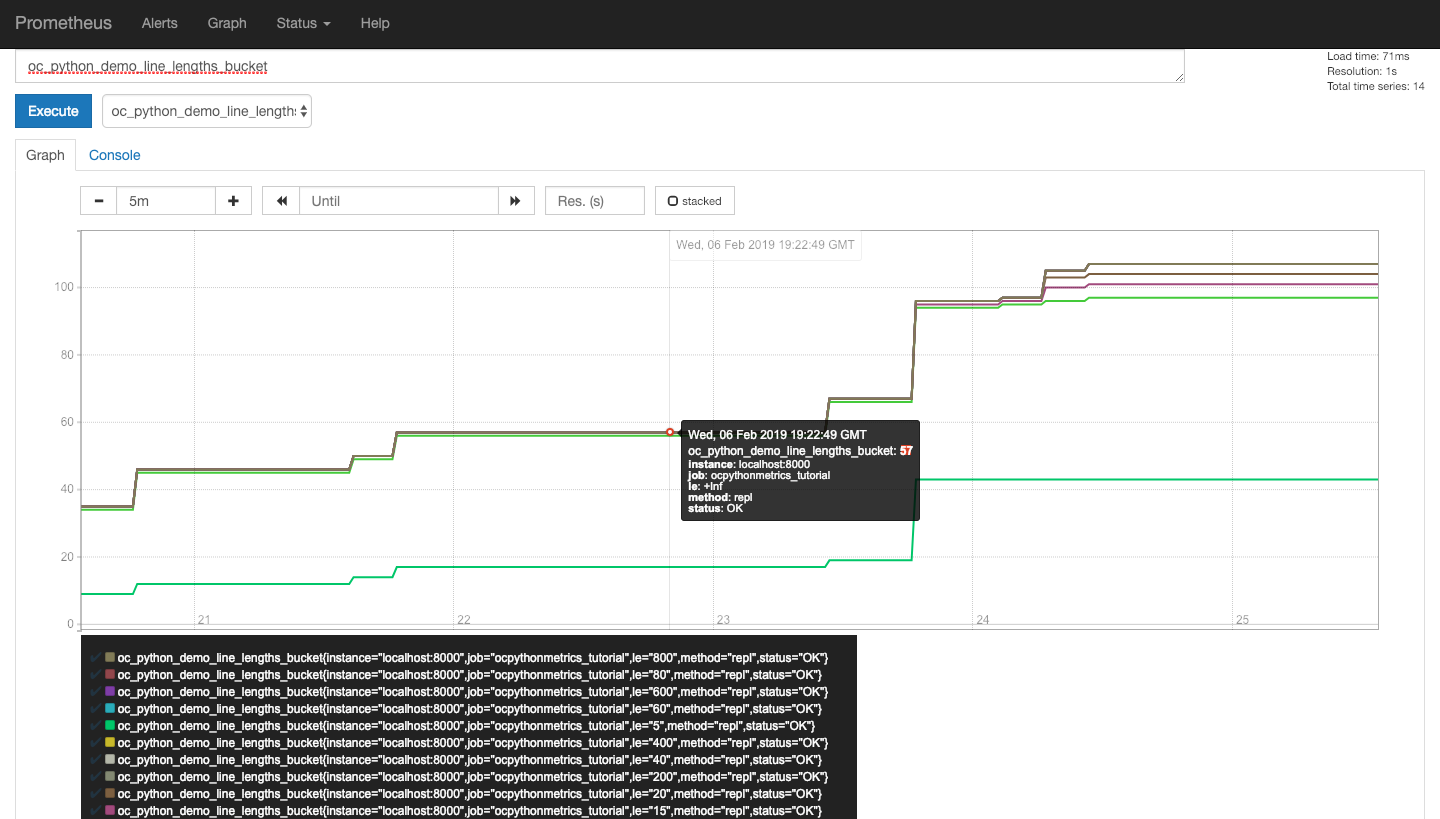
With the above you should now be able to navigate to the Prometheus UI at http://localhost:9090 which should show:
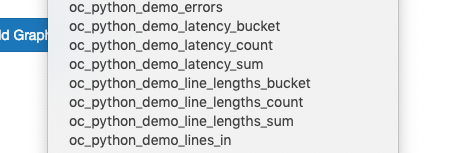
Available metrics

Lines-in counts

Latency distributions

Line lengths distributions

References
| Resource | URL |
|---|---|
| Prometheus project | https://prometheus.io/ |
| Setting up Prometheus | Prometheus Codelab |
| Python exporters | Python exporters |
