Prometheus
Introduction
The OpenCensus Service allows you to export metrics that are collected to Prometheus.
Configuration
In the Service’s YAML configuration file, under section “exporters” and sub-section “prometheus”
Format
With these fields below
exporters:
  prometheus:
    namespace: "<namespace>"
    address: "<port:host>"
    const_labels: {
        "<key1>":"<value1>",
        "<key2>":"<value2>"
    }
End to end example
In this end-to-end example, we’ll have the OpenCensus Service running and a couple of Go applications that use the Go ocagent-exporter to send over metrics and traces to the OpenCensus Service
Running OpenCensus Service
On starting the OpenCensus Service with the configuration below:
exporters:
  prometheus:
    namespace: "promdemo"
    address: "localhost:8888"
    const_labels: {
        "vendor": "otc"
    }
Running Prometheus
As specified above in Running OpenCensus Service by “address”: “localhost:9090”, please have your Prometheus server running by also configuring
its configuration file prom.yaml
# Saved into prom.yaml
scrape_configs:
  - job_name: 'agent1'
    scrape_interval: 5s
    static_configs:
      - targets: ['localhost:8888']
and then running Prometheus
prometheus --config.file=prom.yamlRunning Application Code
And then running the ocagent-go-exporter main.go application
The ocagent.WithAddress can be changed in main.go to point to the OpenCensus Collector directly if desired.
$ GO111MODULE=on go run example/main.go
#0: LineLength: 469By
#1: LineLength: 794By
Latency: 132.649ms
#0: LineLength: 448By
#1: LineLength: 420By
#2: LineLength: 486By
#3: LineLength: 473By
Latency: 1066.808ms
Results
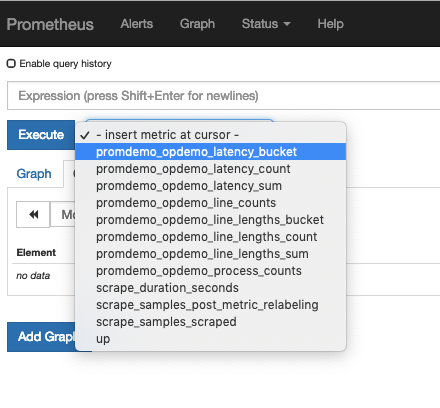
On navigating to the Prometheus UI at http://localhost:9090
All metrics
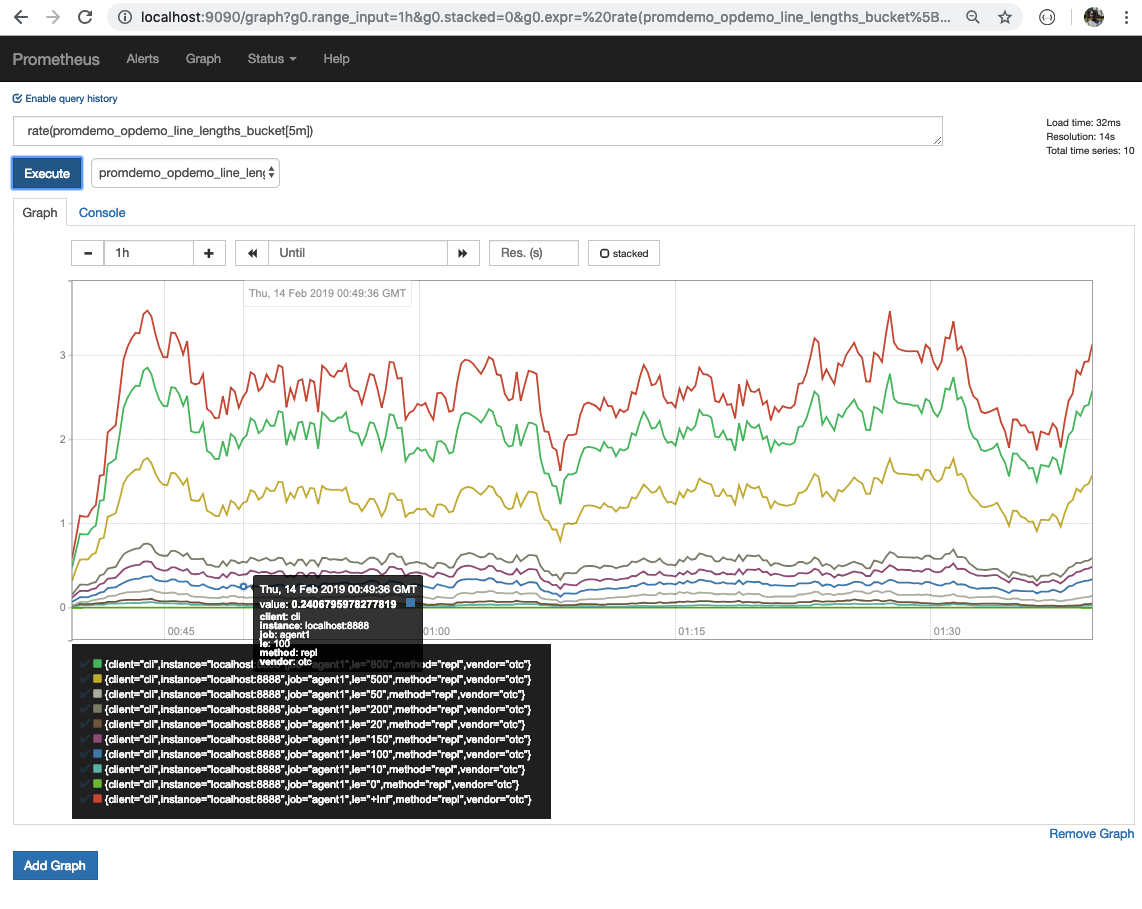
Rates for individual line length buckets
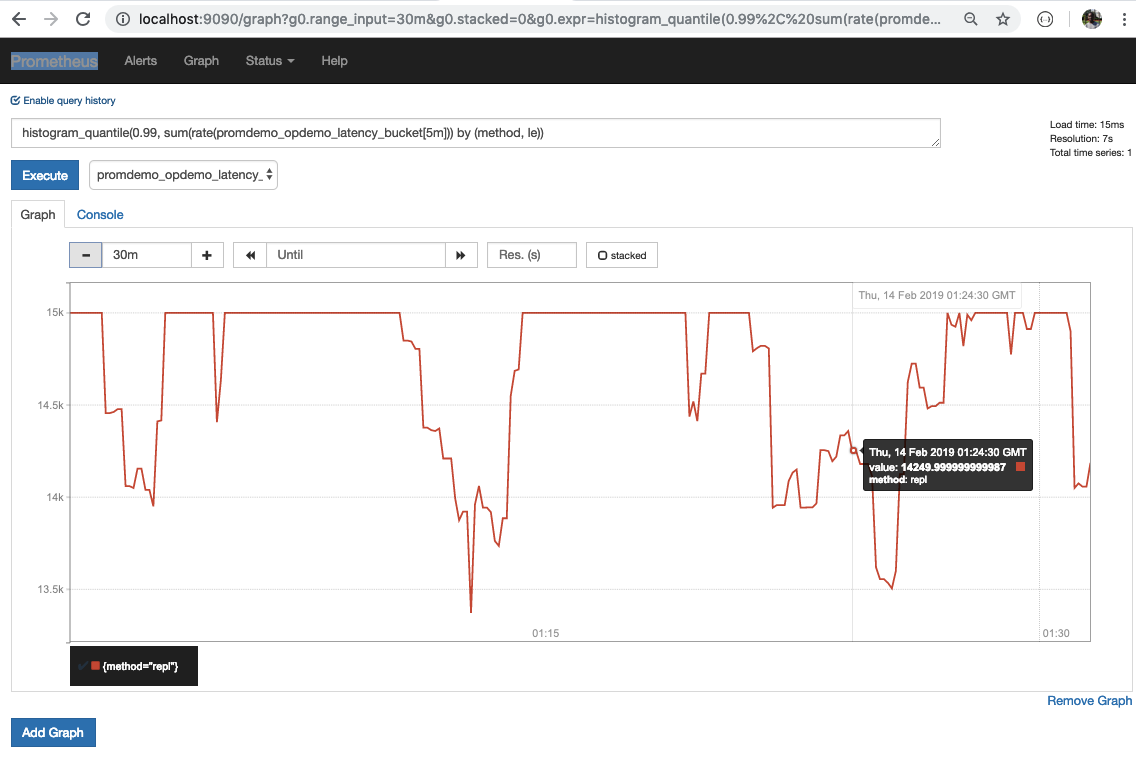
p99th latencies
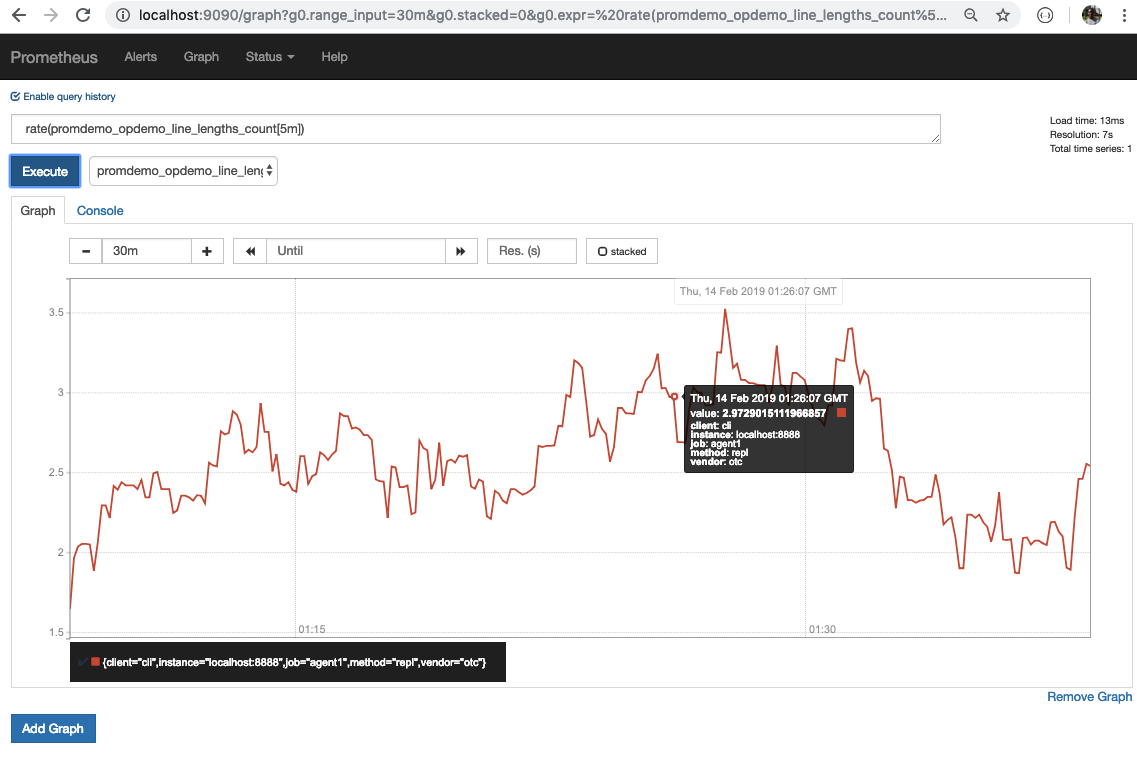
Rates for line counts
References
| Resource | URL |
|---|---|
| Prometheus project home | https://prometheus.io |
| Go ocagent-exporter demo | ocagent-demo |