Tracing
Tracing
Tracing tracks the progression of a single user request as it is handled by other services that make up an application.
Each unit work is called a Span in a trace. Spans include metadata about the work, including the time spent in the step (latency), status, time events, attributes, links. You can use tracing to debug errors and latency issues in your applications.
Trace
A trace is a tree of spans. It is a collective of observable signals showing the path of work through a system.
A trace on its own is distinguishable by a unique 16 byte sequence called a TraceID.
This TraceID groups and distinguishes spans. We’ll learn about spans shortly.
This is an example of what a trace looks like:
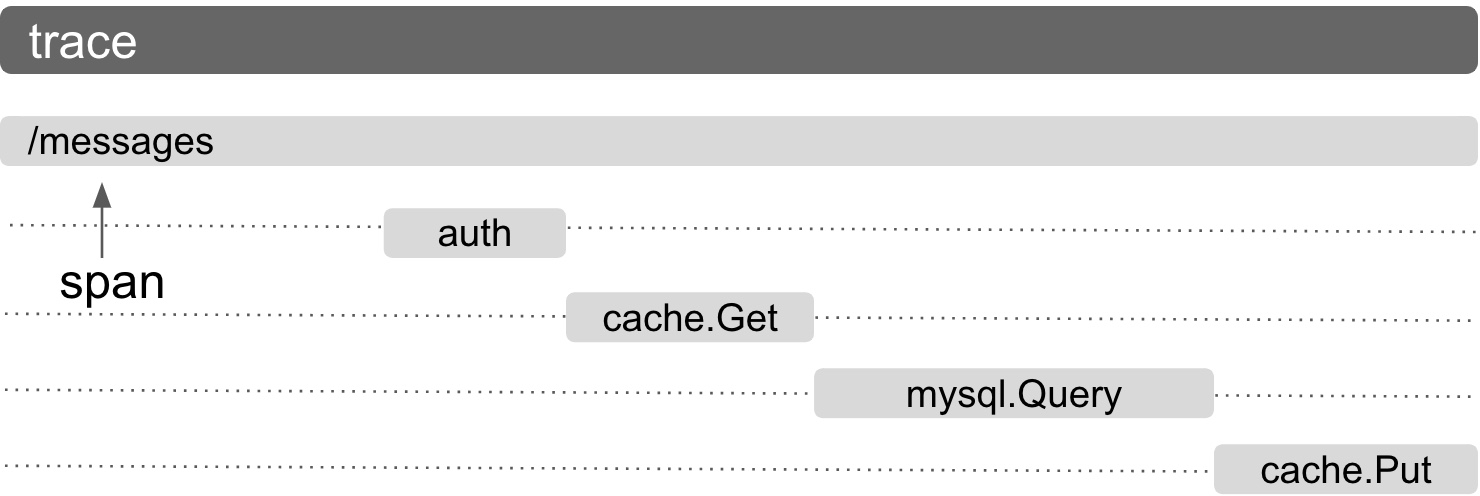
Above, you see a trace with various spans. In order to respond
to /messages, several other internal requests are made. Firstly,
we check if the user is authenticated. Next we check if their
messages were cached. Since their message wasn’t cached, that’s
a cache miss and we then fetch their content from MySQL, cache it
and then provide the response containing their messages.
Exporting
Recorded spans can be exported by registered exporters.
Multiple exporters can be registered to upload the data to various different backends. Users can unregister the exporters if they are no longer needed.
Please visit the page exporters to learn more about exporters.
References
| Resource | URL |
|---|---|
| Trace specs | specs/Trace |
| Trace proto definition | proto/Trace/v1 |